Short Wavelength Automated Perimetry and Peripapillary Retinal Nerve Fiber Layer in Early Diabetes
Nikki Doreen S. Angbue Te, MD, Pearl M. Tamesis-Villalon, MD, Romulo N. Aguilar, MD, Joseph Anthony J. Tumbocon, MD, Kristine D. Corpus, MD
Diabetic retinopathy (DR) remains a major cause of morbidity in diabetic patients and is one of the leading causes of preventable blindness in developing countries. It carries a significant socioeconomic cost for healthcare systems worldwide. Since diabetes is expected to increase from 366 million in 2011 to 552 million in 2030, DR will become a serious problem in the future.3 The global public health burden of DR highlights the significance of early detection and searching for new approaches beyond current standards of diabetes care.
In our study, both SMILE and F-LASIK showed excellent efficacy, safety, and predictability. SMILE was comparable to F-LASIK. Its efficacy and safety indices were analogous with other studies on femtosecond lenticule extraction procedure by Kamiya et al.,5 and SMILE by Hjortdal et al.10 However, there is a slight delay in visual recovery in SMILE. Both groups showed a recovery trend as time passed.
DR is considered to be a microvascular complication caused by the imbalance in the metabolic pathways secondary to hyperglycemia. The clinically demonstrable changes in the retinal vasculature in diabetes have led to the general assumption that the retinopathy is solely a microvascular disease. However, the retina is not mainly a vascular tissue; rather, it is a neurovascular unit interconnected to form functional molecular interactions.
Both SMILE and F-LASIK (54.3% and 55.3%) groups had a favorable tendency toward emmetropia at 1 month postoperatively onwards. SMILE-treated eyes were closer to emmetropia than the F-LASIK treated eyes at 3 months and 1 year postoperatively (54.3% vs 47.4%; 60% vs 50%). This is similar to the study of Vestergaard et al.
A diagnosis of DR is given once microangiopathic signs such as microaneurysms, the first visible fundus manifestations are detected in the retina. Emerging evidence shows that the increase in oxidative stress due to diabetes leads to retinal ganglion cell (RGC) apoptosis and glial cell impairment and loss even before microangiopathic signs are seen. Indeed, RGC apoptosis has been noted in animal models as early as 14 weeks, while a manifest vasculopathy was not observed until approximately 6 months after the induction of diabetes.8 This may imply that neuronal dysfunction can occur prior to clinically detectable signs of vasculopathy.
This neurodegeneration corresponds with previous functional studies showing neuroretinal deficits including electroretinogram (ERG) abnormalities, loss of dark adaptation, color disturbances and decrease in contrast sensitivity in patients with diabetes without clinically detectable retinopathy.9-13 However, visual field defects occurring in early diabetes have received comparatively little attention. Majority of studies on visual fields in diabetic retinopathy used Standard Automated Perimetry (SAP) which resulted in reduction of retinal sensitivity in diabetic subjects without retinopathy as well as those with more severe retinopathy.
In this investigation, sensitivity was assessed using short wavelength automated perimetry (SWAP), a more selective perimetry designed to expose blue stimuli on an intense yellow background and is established in detecting pre-perimetric glaucoma. The principle of this method is selectively testing the short wavelength sensitive (SWS) cone mechanisms which are less redundant and are reported to be more susceptible to damage in diabetes. Previous studies have reported earlier functional deficits in diabetic patients with minimal to no retinopathy using the SWAP technique compared to SAP.
This study aims to determine the significance of SWAP in detecting changes in retinal sensitivity in early diabetic patients without retinopathy and with mild NPDR and to correlate these findings with the peripapillary RNFL thickness as well as glycemic control (HBA1C). To our knowledge, this is the first study correlating functional changes using SWAP and morphologic changes in peripapillary RNFL thickness using SD-OCT in early diabetics.
This study may aid in early functional monitoring of diabetics even before clinically detectable vascular manifestations are evident. SWAP and peripapillary RNFL thickness may serve as functional biomarkers of visual dysfunction in early diabetics. From the clinical point of view, the early identification of neurodegeneration will be crucial for implementing an early treatment based on drugs with a neuroprotective effect.
MATERIALS AND METHODOLOGY
This is a prospective, cross-sectional study. The study population consisted of 40 eyes of 40 patients with type 2 diabetes of less than 5 years duration, at least 18 years of age without signs of diabetic retinopathy and with mild non-proliferative diabetic retinopathy (NPDR) from private clinics and social service department (Ophthalmology, Internal Medicine and Endocrinology) of St. Luke’s Medical Center, Quezon City from November 2015-June 2016. This study protocol was reviewed and approved by the Institutional and Ethics Review Board of St. Luke’s Medical Center. The study adhered to the tenets of the Declaration of Helsinki. All subjects provided signed informed consents.
Exclusion criteria were the following: history of glaucoma or ocular hypertension, media opacity, best corrected visual acuity (BCVA) worse than 20/40 (logMAR 0.3), refractive error of more than +6D, astigmatism of more than +3D, diabetic macular edema or other causes of macular edema or pathology, prior laser therapy or ocular surgery, ocular diseases such as cataract worse than nuclear sclerosis (NS) 2 by Lens Opacity Classification Study (LOCS) III, vision-threatening retinal diseases, uveitis or neurologic problem and unreliable visual field results.
Procedures
After securing the informed consent, all subjects underwent routine history taking focusing on age, diabetes duration and treatment. Complete eye examination was performed which consisted of BCVA, refraction, intraocular pressure (IOP), slitlamp anterior segment examination and dilated fundus examination using indirect ophthalmoscopy. Patients were then stratified into no DR group and mild DR group. Patients were then scheduled for the examination proper. Blood samples were then collected for glycosylated hemoglobin (HBA1C) (Variant II Haemoglobin A1C program, Bio-Rad, Hercules, CA, USA).
Visual fields were first tested using the Humphrey visual field analyzer (model 750; Humphrey-Zeiss, San Leandro, CA) with size V stimulus, blue in yellow background and SITA-SWAP strategy. Two SWAP tests were performed to rule out learning curve 1 week apart. Results were considered reliable if there were less than 20% fixation losses, less than 33% false negatives and less than 33% false positives.
Pupils were then dilated using Sanmyd-P eye drops (Tropicamide 0.5%, Phenylephrine HCl 0.5%) every 15 minutes for 2 doses. Cirrus HD-OCT (Carl Zeiss Meditec, Inc. Dublin, CA) optic disc cube program was used to measure the average peripapillary RNFL thickness. Zeiss Visupac FF450 plus IR (Carl Zeiss Meditech AG, Germany) was used to take the ETDRS Modified 7-field stereoscopic photos.
Outcome Measures
The primary outcome measure was mean deviation (MD) among diabetic patients with no DR and mild NPDR.
Secondary outcome measures were pattern standard deviation (PSD), average peripapillary RNFL thickness, correlation of MD with average RNFL thickness and correlation of MD with HBA1C among diabetic patients with no DR and mild NPDR.
Outcome Measures
Sample size was calculated based on the study of Zico et al.21 wherein the standard deviations of MD of controls versus no signs of DR are 2.02 and 1.12, respectively. Given an alpha error of 0.05, Power of 95%, Type 2 hypothesis, effect size of 2.19, the sample size calculated per group was 18. 18 multiplied by 2 groups are 36 which were the minimum total subjects needed.
Data Analysis
Data were analyzed using the SSPS software version 20 (SSPS Inc., Chicago, IL, USA). T-test was used to analyze the mean difference in MD, PSD and average peripapillary RNFL thickness among the subjects with no signs of DR and mild NPDR. Linear regression was used to correlate the relationship of MD with the average peripapillary RNFL thickness and HBA1C among the population. Significance was attributed when P <0.05.
RESULTS
Demographic Characteristics
Among the 40 subjects, 3 were excluded due to unreliable visual field results. Thus, a total of 37 eyes of 37 patients were included in the study. The eye with the worse diagnosis was considered. If both eyes had similar diagnosis, the study eye was randomly selected.
The subjects had a mean age of 52 ± 8.12 years of age (range 32-68). Mean BCVA was 0.06 ± 0.10 logMAR. The mean HBA1C was 6.7 ± 1.24 (range 5.2-9.6), while the mean duration of diabetes was 2.95 ± 1.47 years. 18 eyes had no signs of DR and 19 had mild NPDR. The demographic characteristics are presented in Table 1.

The mean deviation (MD) in mild NPDR group was -4.46 ± 3.03 dB which was more depressed compared to the no DR group which was -2.94 ± 2.21 dB. However, the difference was not statistically significant (p= 0.09). The pattern standard deviation (PSD) was also more depressed in those with mild NPDR compared to those with no DR (3.08 ± 1.28 dB vs 2.69 ± 0.47dB). However, no statistically significant difference was seen (p= 0.23). No significant difference was seen between the peripapillary RNFL thickness between the mild NPDR group and no DR group (98.47 ± 6.89 vs 98.72 ± 11.01, p= 0.93).
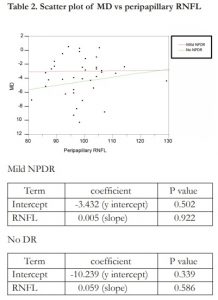
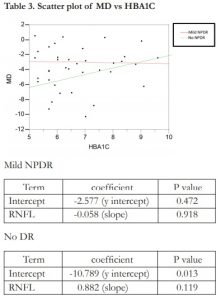
Linear regression analysis showed no correlation between MD and peripapillary RNFL thickness in the no DR group (R2= 0.017) and mild NPDR group (R2= 0.000). A scatter plot of MD vs peripapillary RNFL is shown in Table 2. There was a weak and positive correlation between MD and HBA1C in those with no DR (R2= 0.137). However, there was no correlation found between MD and HBA1C in those with mild DR (R2 = 0.000). A scatter plot of MD vs HBA1C is shown in Table 3.
DISCUSSION
This study compares functional deficits measured by short-wavelength automated perimetry and structural change measured by average peripapillary RNFL thickness in early diabetic patients with no signs of diabetic retinopathy and mild nonproliferative diabetic retinopathy.
Our study did not find a statistically significant difference in the MD and PSD between the mild NPDR group and no DR group. This was in contrary to the study of Zico et al. which showed that SWAP MD was more depressed in the mild NPDR group compared to the no DR group (-5.74 ± 3.11 vs -4.44 ± 2.02, p= 0.04) which suggests that generalized reduction in retinal sensitivity was greater in mild NPDR compared to those with no DR. SWAP PSD, a measurement of localized visual field defects, was also found to be more depressed in the mild NPDR group compared to the no DR group (3.02 ± 0.92 vs 2.11 ± 0.98, P= 0.005). This implies that localized defects were deeper in those with mild NPDR compared to those with no DR. In comparing between SWAP and SAP, it was found that the SWAP MD was more depressed than SAP MD in both study groups which confirms the findings that short wavelength sensitivity is affected earlier than achromatic sensitivity in early diabetic retinopathy.21 This was also consistent with the study of Afrashi et al. which showed that the diabetic group had a significantly lower MD compared to control group (-5.23 ± 3.67 vs -1.18 ± 2.40, p=0.000). However, no statistically significant difference was found in the PSD between diabetic group and control group (3.17 ± 1.07 vs 3 ± 1.07, p= 0.34).
Consistent data have shown that SWAP MD is more reduced in diabetic retinopathy. This is explained by the susceptibility of the short wavelength sensitive cones to ischemic stimuli thus leading to early selective loss of this cell component. Short wavelength sensitive cones are also less redundant leading to early detection of losses.
Our study yielded results which were contrary to those published. Possible explanations are the test retest variability of SWAP and the lens absorption properties. The study by Bengtsson et al. showed that MD test retest variability was greater with SWAP compared to SAP (p= 0.000) with a median variability of 1.34 dB for SWAP and 0.71dB for SAP. Another explanation is the absorption properties of the lens. Cataract absorbs the short wavelength stimulus thus decreasing its transmission which leads to the reduction of the hill of vision. This translates to more depressed visual fields. A study by Lutze et al. also suggests that increase rate of lens density reported in diabetic patients can lead to an apparent reduction in S cone system sensitivity.
In our study, VA was not found to be a significant confounding factor, since 72.9% have a VA of 0.0 logMAR and both subgroups had almost similar VA (0.033 ± 0.840 in the mild NPDR group vs 0.079 ± 0.113 in the no DR group). However, it was noted that among the 37 subjects, 72.9% were above 50 years of age and those in the no DR group were older and had a larger standard variation compared to the mild NPDR group (52.84 ± 9.032 vs 51.33 ± 7.203). It was also found that the no DR group had a longer duration of diabetes (3.37 ± 1.535 vs 2.50 ± 1.295) and poorer glycemic control (7.232 ± 1.281 vs 6.228 ± 0.998) compared to the mild NPDR group. Therefore in our study, age and diabetes-induced increase in lens density may have had some contribution in the reduction of S cone system sensitivity in these patients.
The pathophysiology behind the deterioration of test points despite the absence of retinopathy can only be speculated upon. In glaucoma, it has been established that structural damage precedes functional damage.25 In diabetes, recent studies have demonstrated that retinal neurodegeneration is present even before the development of clinically detectable microvascular damage. Oxidative stress leads to retinal ganglion cell (RGC) apoptosis even without overt signs of diabetic retinopathy.5-8,16,26 Recent studies have consistently shown that macular RNFL and ganglion cell layer (GCL) are thinner in diabetic patients without signs of retinopathy compared controls.27-30 However, there is conflicting data on the occurrence of peripapillary RNFL thinning in diabetic patients without detectable diabetic retinopathy.
Our study showed that there is no statistical difference in the peripapillary RNFL of mild NPDR compared to those with no DR. This was similar to the study of Oshitari et al. which showed no significant change in peripapillary RNFL thickness in patients with no DR compared to controls31. In contrary, a metaanalysis showed that the average peripapillary RNFL thickness in diabetic patients without diabetic retinopathy was significantly decreased compared to controls (P = 0.0003).
The discrepancy in our result may be due to the fact that RNFL thickness is known to decrease with increasing age.33 Since majority of our subjects were above 50 and the subjects in the no DR group were older, the normal aging process might have masked the small differences between the 2 groups.
The study of Ozdek et al. found that there was an evident decrease in the peripapillary RNFL thickness as the retinopathy and glycemic control worsened.34 However, our study revealed no correlation between MD and peripapillary RNFL thickness in mild NPDR and no DR. This may be due to the variability of the SWAP perimetry and age-related attenuation of the RNFL.
In those with mild NPDR, no correlation was found between the MD and HBA1C. This was in contrary to the study of Zico et al, which showed a significant correlation between SWAP MD and HBA1C.21 Surprisingly, in the no DR group, there is a weak and positive correlation between HBA1C and MD which suggests that as the HBA1C worsens, there is improvement in the MD. This can be due to the higher HBA1C found in the no DR group compared to the mild NPDR group and the variability that HBA1C contributes to the visual function. The study of Bengtsson et al. revealed that HBA1C can be a factor for variability at peripheral test points but not at paracentral points of the visual field. A positive correlation was seen with SAP which indicates that an increase in HBA1C fluctuation, increases variability. However, there is a negative correlation with SWAP which suggests that a decrease in HBA1C fluctuation, increases variability.
Knowledge of the random test retest variability is essential in interpreting perimetric tests. Because of the variability of SWAP, it has been suggested that SAP and FDT are more reliable functional tools for monitoring progression in those without signs of diabetic retinopathy.
In conclusion, SWAP does not appear to be a sensitive measure of worsening retinopathy in older individuals with early diabetes. The usefulness of SWAP and peripapillary RNFL thickness in the early stages of retinopathy are inconclusive. Whether SWAP can essentially be used for early screening requires further studies. Nevertheless, neurodegenerative changes of retina and corresponding visual functional impairment in diabetics need more attention during evaluation of diabetic retinopathy.
This study has some limitations. First of all, majority of those recruited were above 50. Therefore, age-related lens changes were inevitable. The study characteristics were also not uniform. This could have led to the variability in the SWAP indices. Recommendations for further studies would be to increase the sample size and to recruit young diabetic patients with clear lens and 20/20 vision. By removing the possible confounders, the tests may yield more conclusive results.
St. Luke’s Medical Center Research and Biotechnology for graciously providing the grant for this study.
Glenn Abundo, MD, Patrick Mendiola, MD, Endocrinology Fellows, Internal Medicine and Ophthalmology Residents for referring their patients for this study.
Macario Reandelar, MD, MSPH, the statistician, for his expertise in the analysis and interpretation of data.
REFERENCES
1. Yau, JW, Rogers SL, Kawasaki R, et al. Global prevalence and major risk factors of diabetic retinopathy. Diabetes Care. 2012;35:556-64.
2. Heintz E, Wiréhn AB, Peebo BB, et al. Prevalence and health care costs of diabetic retinopathy: a population-based register study in Sweden. Diabetologia. 2010;53:2147-54.
3. Whiting DR, Guariguata L, Weil C, et al.. IDF diabetes atlas: global estimates of the prevalence of diabetes for 2011 and 2030. Diabetes Res Clin Pract. 2011;94:311-21.
4. Hellgren KJ, Agardh E, Bengtsson B. Progression of early retinal dysfunction in diabetes over time: results of a long-term prospective clinical study. Diabetes 2014;63:3104–3111.
5. Stem MS, Gardner TW. Neurodegeneration in the pathogenesis of diabetic retinopathy: molecular mechanisms and therapeutic implications. Curr Med Chem. 2013;20:3241–3250.
6. Fletcher EL, Phipps JA, Wilkinson-Berka JL. Dysfunction of retinal neurons and glia during diabetes. Clin Exp Optom 2005;88:132-145.
7. van Dijk HW, Verbraak FD, Stehouwer M, et al. Association of visual function and ganglion cell layer thickness in patients with diabetes mellitus type 1 and no or minimal diabetic retinopathy. Vision Res. 2011;51:224-228.
8. Martin PM, Roon P, Van Ells TK, et al. Death of retinal neurons in streptozotocin-induced diabetic mice. Invest Ophthalmol Vis Sci 2004;45:3330-36.
9. Jackson GR, Barber AJ. Visual dysfunction associated with diabetic retinopathy. Curr Diab Rep. 2010;10:380-384.
10. Gardner TW, Abcouwer SF, Barber AJ, et al. An integrated approach to diabetic retinopathy research. Arch Ophthalmol. 2011;129:230-235.
11. Yamamoto S, Kamiyama M, Nitta K, et al. Selective reduction of the S cone electroretinogram in diabetes. Br J Ophthalmol. 1996;80:973-975.
12. Han Y, Adams AJ, Bearse MA Jr, et al. Multifocal electroretinogram and short-wavelength automated perimetry measures in diabetic eyes with little or no retinopathy. Arch Ophthalmol. 2004;122:1809-15.
13. Gualtieri M, Feitosa-Santana C, Lago M et al. Early visual changes in diabetic patients with no retinopathy measured by color discrimination and electroretinography. Psychology & Neuroscience. 2013;6:227-234.
14. Trick G, Trick L, Kilo C. Visual field defects in patients with insulin-dependent and noninsulin-dependent diabetes. Ophthalmology 1990;97:475-482.
15. Bengtsson B, Heijl A, Agardh E. Visual fields correlate better than visual acuity to severity of diabetic retinopathy. Diabetologia. 2005;48:2494-500.
16. Hellgren KJ, Bengtsson B, Agardh E. Functional and structural change in diabetic eyes. Interim results from an ongoing longitudinal prospective study. Acta Ophthalmologica. 2013;91:672-7.
17. Cho NC, Poulsen GL, Ver Hoeve JN, et al. Selective loss of S-cones in diabetic retinopathy. Arch Ophthalmol. 2000;118:1393-400.
18. Afrashi F, Erakgün T, Köse S, et al. Blue-on-yellow perimetry versus achromatic perimetry in type 1 diabetes patients without retinopathy. Diabetes Res Clin Pract. 2003;61:7-11.
19. Remky A, Arend O, Hendricks S. Short-wavelength automated perimetry and capillary density in early diabetic maculopathy. Invest Ophthalmol Vis Sci. 2000;41:274-281.
20. Nitta K, Saito Y, Kobayashi A, et al. Influence of clinical factors on blue-on-yellow perimetry for diabetic patients without retinopathy: comparison with white-on-white perimetry. Retina. 2006;26:797-802.
21. Zico OA, El-Shazly AA, Abdel-Hamid Ahmed EE. Short-wavelength automated perimetry can detect visual field changes in diabetic patients without retinopathy. Indian J Ophthalmol 2014;62:383-7.
2. Bengtsson B, Hellgren KJ, Agardh E. Test-retest variability for standard automated perimetry and short-wavelength automated perimetry in diabetic patients. Acta Ophthalmol. 2008;86:170-6.
23. Wild JM. Short wavelength automated perimetry. Acta Ophthalmol Scand 2001:79:546-559.
24. Lutze M, Bresnick GH. Lens-corrected visual field sensitivity and diabetes. Invest Ophthalmol Vis Sci. 1994;35:649-55.
25. Malik R, Swanson WH, Garway-Heath DF. ‘Structure-function relationship’ in glaucoma: past thinking and current concepts. Clin Experiment Ophthalmol. 2012;40:369-80.
26. Villarroel M, Ciudin A, Hernandez C, et al. Neurodegeneration: an early event of diabetic retinopathy. World J Diabetes. 2010;1:57–64, 2010.
27. Asefzadeh B, Fisch BM, Parenteau CE, et al. Macular thickness and systemic markers for diabetes in individuals with no or mild diabetic retinopathy. Clin Exp Ophthalmol. 2008;36:455-463.
28. Biallosterski C, van Velthoven ME, Michels RP, et al. Decreased optical coherence tomography-measured pericentral retinal thickness in patients with diabetes mellitus type 1 with minimal diabetic retinopathy. Br J Ophthalmol. 2007;91:1135-1138.
29. Vujosevic S, Midena E. Retinal layers changes in human preclinical and early clinical diabetic retinopathy support early retinal neuronal and Müller cells alterations. J Diabetes Res. 2013;2013:905058.
30. van Dijk HW, Verbraak FD, Kok PH, et al. Early neurodegeneration in the retina of type 2 diabetic patients. Invest Ophthalmol Vis Sci. 2012;53:2715-2719.
31. Oshitari T, Hanawa K, Adachi-Usami E. Changes of macular and RNFL thicknesses measured by Stratus OCT in patients with early stage diabetes. Eye (Lond). 2009;23:884-9.
32. Chen X, Nie C, Gong Y, et al. Peripapillary retinal nerve fiber layer changes in preclinical diabetic retinopathy: a meta-analysis. PLoS One. 2015;10:e0125919.
33. Kim EJ, Hong S, Kim CY et al. Attenuated age-related thinning of peripapillary retinal nerve fiber layer in long eyes. Korean J Ophthalmol. 2011;25:248–251.
34. Özdek S, Lonneville YH, Önol M, et al. Assessment of nerve fiber layer in diabetic patients with scanning laser polarimetry. Eye 2002;16:761–765.