Clinical Profile and Demographics of Glaucoma Patients Managed in a Philippine Tertiary Hospital
Jose Ma. Martinez, MD and Mark Angelo B. Hosaka, MD
Glaucoma is the leading cause of irreversible blindness worldwide, affecting all age groups, gender, and race. In 2010, it has been estimated that 60 million people have open angle and angle closure glaucoma. By 2020, this number will increase by 20 million.1
Compared to Caucasians or the black race, it has been observed that Asians have a higher prevalence of angle-closure glaucoma2-5. Population-based studies in Singapore, Thailand, Myanmar, and India showed a prevalence of glaucoma among patients 40 years old and above at 3.2%6, 3.8%7, 4.9%8, and 2.7%9 respectively. Singapore and Thailand showed a higher prevalence of primary open angle glaucoma while primary angle closure glaucoma was the most common type seen in Myanmar. In a Philippine population-based survey done in 2001 to 2002, glaucoma was ranked as the third most common cause of bilateral blindness, and the fifth most common cause of low vision.10
Currently, there are no population-based prevalence studies on glaucoma locally although there was a hospital-based cross-sectional study11 published previously showing the prevalence and distribution of the types of glaucoma seen in a public tertiary hospital. There is still further need to gather more data on the types of glaucoma seen in other settings.
The International Society of Geographic and Epidemiological Ophthalmology (ISGEO) guidelines12 were developed to standardize identification of the different types of glaucoma across epidemiological studies. The guidelines were applied to glaucoma cases seen in the charity division of a private tertiary hospital. The Brusini Glaucoma Staging System was developed to classify visual defects seen in glaucoma patients13. It was also utilized in the study to estimate the severity of glaucoma.
Our study focused on further characterizing glaucoma cases seen in a Philippine tertiary hospital using standard internationally accepted terminology. It determined the clinical profile and demographics of glaucoma patients seen from 2011 to 2014. It determined the prevalence, age and sex distribution, clinical features, and the initial management of the different types of glaucoma based on the ISGEO guidelines and determined the distribution of severity of visual field loss using the Brusini’s Glaucoma Staging System 2.
METHODOLOGY
Study Design
The charts of glaucoma patients managed at the St. Luke’s Medical Center ophthalmology out-patient clinic from October 2010 to August 2014 were reviewed. The study was carried out in accordance with the tenets of the Declaration of Helsinki. Diagnosis of the presence of glaucomatous optic neuropathy was based on the ISGEO guidelines12 (Table 1).

Table 1. International Society for Geographic and Epidemiological Ophthalmology (ISGEO) Classification of Glaucoma.
Clinical Examination
Best-corrected visual acuity was obtained using the Snellen chart and converted to LogMAR values. Refraction was based on the current corrective lens power or automated refractor. Intraocular pressure was obtained with either the Goldman applanation tonometer (Haag-Streit, Koeniz, Switzerland) or the Tonopen (Reichert AMETEK, NY, USA). Intraocular pressures were obtained twice and averaged. The vertical cup-disc ratio (CDR) was estimated at the slit-lamp with the use of a Volk 78D, 90D, or digital wide field lens (Volk Optical Inc., Ohio, USA). Gonioscopy was performed with a 3-mirror Goldman lens (Haag-Streit, Koeniz Switzerland) or a 4-mirror Zeiss lens (Carl Zeiss, Germany).
Visual Field Testing
Standard automated perimetry (SAP) was used to quantify glaucomatous functional damage with the Octopus perimeter (Haag-Streit, Koeniz, Switzerland) using tG2 program (central 30 degrees, size III white stimulus, and TOP strategy). The test was considered reliable if there was <20% fixation losses and <33% false-positive and false-negative errors. Perimetry of patients diagnosed with previous retinal laser treat-ment, significant anterior segment disease, extreme error of refraction, macular pathology, and non-glaucomatous optic neuropathy were excluded. At least two perimetry studies with reproducible visual defects were included in the study. The eye with the worse visual acuity and/or visual-field defects were included in the analyses.
Data Collection
The following data were obtained, tabulated, and organized using Microsoft Excel 2011: name and file number of patient, age, sex, family history of glaucoma, best-corrected visual acuity (BCVA) and refraction, initial intraocular pressure (IOP) at presentation, vertical cup-disc ratio (CDR) and CDR asymmetry, diagnosis, severity of glaucoma based on GSS 2 at presentation, initial management, use of anti-glaucoma medication after glaucoma filtering surgery or insertion of glaucoma drainage device, surgical intervention after failed initial management, etiology of secondary glaucoma.
Severity of glaucoma was based on Brusini’s Glaucoma Staging System (GSS) 2.13 The GSS 2 determined the severity of visual field loss and whether the loss was localized, mixed, or generalized. The system used MD and PSD or LV values, making it applicable to both Humphrey and Octopus perimetry.
Initial management was defined as the therapy instituted within the first two weeks of diagnosis.
Modes of intervention were classified as: observation, anti-glaucoma medication, laser surgery, trabeculectomy, and glaucoma drainage device.
Laser procedures included laser iridotomy (LI), peripheral iridoplasty (PIR), selective or argon laser trabeculoplasty (SLT/ALT), or transscleral cyclophotocoagulation (TSCPC).
Statistics and Data Analysis
Descriptive statistics (mean, standard deviation, range, percentages) and frequency distribution were calculated summarizing the continuous and categorical variables. Chi-square and Fisher’s tests determined statistical significance among compared variables. A p value less than 0.05 was considered significant.
RESULTS
A total of 711 patient charts were reviewed. One hundred forty-one cases had no glaucoma and were excluded. Majority of the 570 patients, mean age of 56.23 years, were females (60.17%). At presentation, 74% (344) had blurring of vision and 15.91% had eye pain or photophobia (Table 2). The mean BCVA was 0.40, the mean IOP was 23.56 mmHg, and the mean CDR was 0.69.

Table 2. Demographic and visual characteristics of the study population (N=570).
There were more primary glaucomas (55.48%) than secondary glaucomas (31%) (Table 3). Primary angle closure glaucoma (PACG) (24.78%) and primary open angle glaucoma (POAG) (22.80%) were similar in occurence. There was a higher female preponderance in PACG and normal tension glaucoma (NTG). Most primary glaucomas were diagnosed with bilateral disease at presentation with no family history (Table 4).
No light perception (NLP) was more commonly seen initially in POAG, but none had bilateral NLP (Table 5).

Table 3. Types of glaucoma in the study population.
*Others included other secondary causes of glaucoma not classified into any subcategory of secondary glaucoma based on ISGEO guidelines. This included elevated episcleral venous pressure, steroid-induced, pseudoexfoliation, and anterior segment dysgenesis.
Table 4. Demographic characteristics of PACG, POAG, and NTG.

Table 5. Comparison of PACG, PAOG, and secondary glaucoma.
1Top 3 chief complaints were considered
2BOV – blurring of vision
3LOV – loss of vision
Table 6. Age-specific prevalence of PACG, POAG, and secondary glaucoma (%; 95% CI).

Patients with secondary glaucoma were younger, with higher mean IOP compared to the primary glaucomas (Tables 5, 6). Among those with secondary glaucoma, surgically-induced type accounted for almost 41% (Table 3), with penetrating keratoplasty and pars plana vitrectomy with or without silicone oil as the main causes. There were 10 cases secondary to elevated episcleral venous pressure (Sturge-Weber syndrome and carotid cavernous fistula), 5 steroid-induced, 1 pseudoexfoliation, and 1 anterior segment dysgenesis (ICE syndrome).
The most common type of visual field pattern at initial presentation was the mixed pattern seen in 49.09%, 41.82%, and 14.55% of PACG, POAG, and NTG respectively (Table 7). Majority of the glaucomatous defects were under GSS 2 stage 2 of mean deviation (MD) and loss variance (LV). The proportion of patients with higher MD and LV was greater among POAG than PACG patients; this difference, however, was not statistically significant (MD: p=0.47 and LV: p=0.38). Twenty-two percent of patients presented with absolute glaucoma, more frequently seen in PACG. No patient presented with absolute glaucoma in both eyes.

Table 7. Pattern of defects and severity among PACG, POAG, and NTG
*MD – mean deviation
**LV – loss variance
Medical treatment was the most common initial management given to glaucoma patients in general (Tables 8 and 9). Among PACG, laser treatment as the initial management was performed in 55.56% (Table 9) while surgical intervention as the initial treatment was more commonly done in secondary glaucoma (36.81%) and PACG (33.33%). Sixty percent of PACG required at least one surgery during the course of their follow up (Table 10).

Table 8. Initial treatment given at first consultation.
1LI – laser iridotomy
2PIR – peripheral iris retraction
3TSCPC – transcleral cyclophotocoagulation
4SLT – selective laser trabeculoplasty
5ALT – argon laser trabeculoplasty
Table 9. Distribution of PACG, POAG, NTG, and secondary glaucoma according to initial treatment given at first consultation.
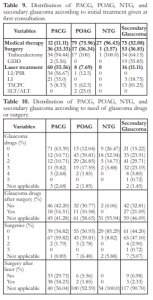
Table 10. Distribution of PACG, POAG, NTG, and secondary glaucoma according to need of glaucoma drugs or surgery.
DISCUSSION
This study provided information on the types of glaucoma being managed at the social service division of a private tertiary hospital. Among the primary subtypes of glaucoma, the most common was PACG. If POAG and NTG were combined, however, the prevalence of open angle glaucoma would be higher than the angle closure types. There were 5 cases of juvenile open angle glaucoma (JOAG) grouped under the POAG group. This study differed from a similar study done by FlorCruz II as a result of differences in disease classification. That study showed that PACG was the most common type of glaucoma seen in a government tertiary hospital.11 It used a different classification of glaucoma from the ISGEO guidelines.
There was also a high proportion of secondary glaucoma in this study, the most common cause surgical followed by neovascular, in contrast to the previous study where lens-related and trauma were prevalent. The following could account for the differences: the increasing prevalence of diabetic retinopathy, the increasing frequency and complexity of surgical procedures performed, and improved surgical techniques for dealing with complicated cataract. The secondary glaucomas were also diagnosed at a younger age, with worse visual acuities upon diagnosis, and higher intraocular pressures compared to the primary glaucomas. This could be attributed to the presence of other ocular pathology that contributed to worse visual function. The presence of a well-established subspecialty referral system in the institution could also lead to more secondary glaucoma referrals.
There were also several causes of glaucoma in this study not classified under any category based on ISGEO guidelines. There were 10 cases of glaucoma secondary to increased episcleral venous pressure from Sturge-Weber syndrome and carotid-cavernous fistula, five cases of steroid-induced glaucoma, and pseudoexfoliation glaucoma. Further expansion of the subcategories of secondary glaucoma is recommended.
To the author’s knowledge, this is the first epidemiologic study that used Brusini’s glaucoma staging system to determine the functional damage and identifying the different components of visual field loss in glaucoma patients. Most patients were seen at relatively earlier stages of the disease. Patients with previous retinal laser procedure or with significant anterior segment pathology were excluded in the study. However, the presence of dense cataract was not evaluated in the study and, thus, might cause a falsely high staging score. Primary open angle glaucoma had the highest rate of absolute glaucoma; this was comparable with the study done by FlorCruz II.11
Despite its limitations, the GSS 2 is an objective method in quantifying functional severity of glaucomatous damage in patients. Further studies are recommended to determine its clinical application.
Since this was a retrospective study, different physicians took the intraocular pressures and assessed the vertical CDR, leading to significant interobserver variability. Another limitation possible was if there was a difference in the diagnosis of glaucoma between fellow eyes, the diagnosis for the subject would only be based on the more severe glaucoma of one eye, leading to altered prevalence rates among the different subgroups. The study also failed to take into account if the patients were previously diagnosed with glaucoma and previously treated in other institution, which might affect the initial IOPs at presentation.
In summary, primary open angle glaucoma (include NTG) as defined by the ISGEO was the most common type of glaucoma seen in a private tertiary hospital. Majority of the secondary glaucomas were surgical-induced, followed by neovascular glaucoma. At presentation, most patients had moderate visual field damage with mixed pattern, commonly managed initially with medical treatment. A population-based study is still needed to establish the true incidence and prevalence of glaucoma in the Philippines.
ACKNOWLEDGMENTS
We thank Dr. Joseph Anthony Tumbocon for the expert advice on methodology and technical aspects of the paper writing, Ms. Charise Gennevieve Ballad for the extensive statistical assistance and support in completing this work.
REFERENCES
1. Quigley HA, Broman AT. The number of people with glaucoma worldwide in 2010 and 2020. Br J Ophthalmol 2006;90:262–267.
2. Salmon JF, Mermoud A, Ivey A, et al. The prevalence of primary angle closure glaucoma and open angle glaucoma in Mamre, Western Cape, South Africa. Arch Ophthalmol 1993;111:1263–9.
3. Foster PJ. The epidemiology of primary angle closure and associated glaucomatous optic neuropathy. Semin Ophthalmol 2002;17:50–8.
4. Bourne RR, Sørensen KE, Klauber A, et al. Glaucoma in East Greenlandic Inuit—a population survey in Ittoqqortoormiit (Scoresbysund). Acta Ophthalmol Scand 2001;79:462–7.
5. Chew PT, Aung T. Primary angle-closure glaucoma in Asia. J Glaucoma 2001;10:S7–8.
6. Foster PJ, Oen FTS, Machin D, et al. The prevalence of glaucoma in Chinese residents of Singapore: cross-sectional population survey of the Tanjong Pagar district. Arch Ophthalmol 2000;118:1105-1111.
7. Bourne RR, Sukudom P, Foster PJ, et al. Prevalence of glaucoma in Thailand: a population-based survey in Rom Klao District, Bangkok. Br J Ophthalmol 2003;87:1069-1074.
8. Casson RJ, Newland HS, Muecke J, et al. Prevalence of glaucoma in rural Myanmar: the Meiktila Eye Study. Br J Ophthalmol 2007;91:710-714.
9. Raychaudhuri A, Lahiri SK, Bandyopadhyay M, et al. A population-based survey of the prevalence and types of glaucoma in rural West Bengal: the West Bengal Glaucoma Study. Br J Ophthalmol 2005;89:1559-1564.
10. Cubillan LD, Santos EO. Third national survey on blindness. Philipp J Ophthalmol 2005;30:100-114.
11. FlorCruz II NV, Joaquin-Quino R, Silva PA, Khu P. Profile of glaucoma cases seen at a tertiary referral hospital. Philipp J Ophthalmol 2005;30:161-165.
12. Foster PJ, Buhrmann R, Quigley HA, et al. The definition and classification of glaucoma in prevalence surveys. Br J Ophthalmol 2002;86:238-242.
13. Brusini P, Filacorda S. Enhanced glaucoma staging system (GSS 2) for classifying functional damage in glaucoma. J Glaucoma 2006;15:40–6.