A Comparison of Distance Visual Acuity Testing using a Standard ETDRS Chart and a Tablet Device
Almira A. Manzano, MD and Michael Angelo N. Lagamayo, MD
Visual acuity (VA) testing is a routine part of every eye exam and an important indicator of visual function. It is a vital screening tool to determine visual problems of an individual. Accurate assessment of visual acuity depends on the viewing distance, illumination, type of eye chart, and the scoring measurement used.1 A reliable measurement of visual acuity is necessary in clinical and research setting.
The ETDRS chart developed in 1982 uses the Ian Bailey and Jan Lovie lay-out designed in 1976 and combined with letter set designed by Dr. Louise Sloan in 1959. The chart resolved the disadvantages of the commonly used Snellen chart. The ETDRS protocol is reduced at standard viewing distance of 4 meters with recommended 85-300 cd/m2 range of chart illumination.2,3 The ETDRS chart and the protocol to test vision with this chart have become the gold standard for current clinical trials. It has been used in world standard research, education, and clinical setting. The letter spacing, number of letters per line, and steps between lines are all standardized. It is better than Snellen chart because inter-patient differences were more accurately measured and longitudinal follow-up measurements had more consistent precision regardless of high or low levels of visual acuity.4 If the chart was moved closer to the patient by 0.1 log step (6 to 4.8 meters or 4.8 to 3.8 meters), there is a 25% increase in angular size of the letters and an additional 1 row on the chart is read.4
There are many forms of visual acuity testing currently used, such as the standard panel eye charts, visual acuity charts in illuminator cabinets, projector eye charts, and computerized VA testing software in an LCD monitor. Another emerging common device that is readily available is an iPad tablet. Different iPad applications for visual acuity testing and other eye tests are readily available in iTunes store that can be easily downloaded, purchased, and displayed in a single portable device such as an iPad. This portable device can make visual screening possible and helpful for many health professionals. However, the disadvantage of this device is that it is highly susceptible to glare, making visual acuity measurements inaccurate. Some studies have shown that distance visual acuity testing using the device was comparable to a standard letter chart provided the sources of glare were eliminated, such as equipping the device with an anti-glare screen protector5 or removing artificial indoor lights reflecting on the device.6
The Chart 2020 Duo with an add-in FLEX visual acuity test by Konan Medical is an example of iPad application which allows clinicians to dynamically and instantly adjust visual acuity test parameters to test distance between 33 cm (14 inches) and 6 meters (20 feet).7 It has visual acuity test in LogMAR letters, similar to the standard ETDRS logMAR charts with equal number of optotypes per line, equal logarithmic interval between lines, equal average legibility for each line, consistent spacing between letters and lines, and geometric progression of letter sizes.3
This study determined if there was a difference in distance visual acuity testing using the iPad 3 device installed with an anti-glare screen and the chart 20/20 Duo FLEX with the standard ETDRS visual acuity chart.
METHODOLOGY
Participants
Healthy volunteers, aged 20-30 years old, with or without spectacle correction were recruited. They underwent visual acuity testing using the standard ETDRS chart and the chart 20/20 Duo FLEX installed in an iPad 3 with anti-glare screen.
After obtaining informed consent, the partici-pants were tested with their habitual refractive correction in place. Testing was done in a quiet, dimmed room with only the participant and the examiner present in order to prevent distractions.
Tools
Distance visual acuity was measured using the standard ETDRS chart (Figure 1) mounted on a light box measured 45 cm x 45 cm with 4 fluorescent light bulbs and placed at a distance of either 4 meters or 2 meters from the participant. The test room was illuminated with 1 fluorescent bulb.
The iPad 3 with retina display (9.7–inch diagonal LED backlit display with 2048 x 1536 resolution at 264 pixels per inch), fitted with an anti-glare matte screen protector and maximum brightness in the display setting, was used throughout all testing procedures. The matte screen protector reduced any disturbing glare or contrast. The device was positioned away from all sources of glare. The iPad device was placed at 2 testing distances, 4 meters and 2 meters from the participant.
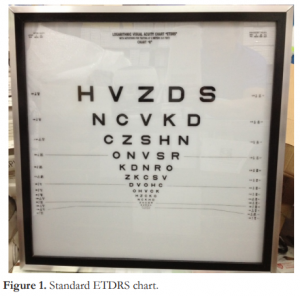
Figure 1. Standard ETDRS chart.
An iPad application chart 2020 Duo FLEX (Figure 2) by Konan Medical, commercially available in Apple iTunes store, was installed in the device. The application has unique features that allow VA test parameters to be tested from 33 cm (14 inches) to 6 meters (20 feet). It includes standard, Sloan specification literate, illiterate, and pediatric optotypes. It intuitively displays acuity lines, single letters, and full charts with smart randomization and reverse contrast. The following features of the chart 2020 Duo FLEX acuity application were constant in all the testing procedures: standard optotypes in logMar measurement, distance in metric system, and full screen optotypes presented in rows.

Figure 2. Chart 2020 Duo FLEX (Ipad application).
Procedure
Subjects were asked to read the optotypes in the standard ETDRS chart at a distance of 4 meters and 2 meters. Subjects were prompted to read the letters one-by-one starting from logMAR 1.0 down to the smallest resolvable optotype at the bottom or up to the line with the most number of correct letters read (more than 3 letters). Visual acuity results were computed [logMAR visual acuity = 0.1 + logMAR value of best line read – 0.02 (number of letters read)] and recorded as logMAR units.
Measurements were done with their habitual refractive correction if any. The participants were tested by one examiner. Right eye was examined first with an occluder on the left, followed by the left eye.
During visual acuity measurement, the iPad 3 device was held perpendicular to the floor and away from any source of glare by the examiner. It was placed at 2 distances from the participant, 4 meters and 2 meters. The VA results at each distance were recorded as logMAR VA.
The testing procedure was conducted under consistent artificial room lighting. Recording of visual acuity measurements was done by the examiner.
Data analysis
Paired t-test was used to analyze the results obtained.
RESULTS
Ninety-two (92) eyes of 46 healthy medical interns were tested. The mean age was 24 years old, 21 males and 25 females. Twenty-one (21) subjects wore their corrective spectacles regularly.
The mean logMAR visual acuity scores at 4 meters obtained from the ETDRS chart and the iPad 3 were 0.165 and 0.093, respectively. The logMAR visual acuity from the iPad was significantly higher than those from the ETDRS chart (p <0.001) (Table 1).
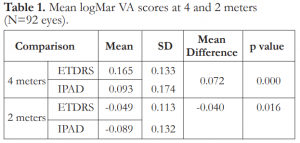
Table 1. Mean logMar VA scores at 4 and 2 meters (N=92 eyes).
Similarly, the mean logMAR visual acuity scores at 2 meters obtained from the ETDRS chart and the iPad were -0.049 and -0.089 respectively. The logMAR visual acuity from the iPad was significantly higher than those from the ETDRS chart (p=0.016) (Table 1).
DISCUSSION
Visual acuity is defined as the spatial resolving capacity of the eye. It is measured by identifying the angle subtended at the eye by the smallest recognizable optotype. Testing visual function using different VA charts should give precise, reproducible result in order to identify only the changes related to the eye disease which is important in clinical and research settings.4
Factors affecting accuracy of visual acuity measurements include: number of letters per line, viewing distance, illumination, optotypes used, and the display method. Visual acuity testing can be displayed in printed charts, translucent chart, projector charts, and computer. Computer displays have several advantages: optotypes can be randomized and display modes can be changed, letter size can be coordinated with actual viewing distance.8 The iPad tablet device is similar to the computer-displayed visual acuity chart. Various kinds of free and paid applications for ophthalmology can be downloaded to an iPad, which is portable and equipped with high resolution screen offering a new method for VA testing.6 The iPad is a readily portable device that can display an assortment of letter and optotype charts at both high and low contrast. It can also support applications that have available standardized charts appropriate for the age to be tested, can randomize letters or optotypes to prevent chart learning, adjust stimulus size to accommodate available viewing distance, vary the screen illumination depending on lighting conditions, can store or transmit data collected, and can ensure correct scoring of visual acuity.5
Visual acuity testing in a portable device, such as an iPad, is an emerging alternative device for accurate acuity measurement. Studies have demonstrated that measurements of visual acuity using the iPad can provide indistinguishable results compared to standard letter chart, as long as sources of glare were eliminated. Fitting the iPad device with an anti-glare screen and positioning it away from sources of glare resulted in visual acuity measurements that were equivalent to those using standard charts.5 However, the results of our study showed that there was a significant difference between visual acuity testing using standard ETDRS chart and the iPad. The logMAR visual acuity from the iPad was significantly higher at 4 meters or at 2 meters compared with the ETDRS chart. The mean difference at 4 meters between the two methods was 0.072 logMAR units or 3- to 4-letter difference, while at 2 meters it was -0.040 logMAR units or 2-letter difference. These findings also differed from previously reported study on tumbling E presented on an iPad device vs conventional light box E chart, revealing no significant difference on distance visual acuity testing between the two.1 Sources of glare from indoor artificial lighting could also reflect on the device and contribute to their differences in visual acuity testing.
Unlike previous studies where older versions of iPad tablets were used, our study used iPad 3 device with high screen resolution (2048 x 1536) permiting presentation of targets small enough to test the limits of normal visual acuity and allowing the testing of 1 minute of visual angle subtended per pixel at a minimum viewing distance of 33 cm. Resolution was defined as the capability to observe or measure the smallest object clearly with distinct boundaries.9 This allowed the dynamic range of luminance for reasonable contrasts to be presented. A better visual acuity score could also be attributed to the high resolution screen of the device.
In order to produce clinically valid vision testing, screen characteristics of tablet computers, such as resolution, brightness uniformity, contrast linearity and the effect of viewing angle, should be assessed.10 These parameters are important to visual psychophysical testing.
The matte anti-glare screen protector fitted in the iPad in this study helped reduce the specular reflection and detrimental effects of glare on contrast. Other factors contributing to the differences in visual acuity in the two devices were the differences in the illumination of the 2 devices.
In summary, distance visual acuity testing using the iPad 3 device with high resolution screen and equipped with anti-glare screen protector showed significantly different visual acuity results from the standard ETDRS chart. Before tablet devices can be used to test visual acuity clinically, they should be standardized and tested in terms of illumination, resolution, brightness uniformity, contrast linearity, and viewing angle.
REFERENCES
1. Kniestedt C, Stamper R. Visual acuity and its measurement. Ophthalmol Clin N Am 2003;16:155-170.
2. Bourne RR, Rosser DA, Sukodom P, et al. Evaluating a new logMar chart designed to improve visual acuity assessment in population-based surveys. Eye (Lond) 2003;17:754-758.
3. Noushad B, Thomas J, Amin SV. Reliability of a modified logMAR distant visual acuity chart for routine clinical use. Oman J Ophthalmol 2012;5:87-90.
4. Kaiser PK. Prospective evaluation of visual acuity assessment: A comparison of Snellen versus ETDRS charts in clinical practice (an AOS thesis). Trans Am Ophthalmol Soc 2009;107:311-324.
5. Black JM, Jacobs RJ, Phillips G, et al. An assessment of the iPad as a testing platform for distance visual acuity in adults. Br Med J Open 2013;3:e002730.
6. Zhang ZT, Zhang SC, Huang XG, et al. A pilot trial of the iPad tablet computer as a portable device for visual acuity testing. J Telemed Telecare 2013;19:55-59.
7. http://www.konanmedical.com/ipad-duo-app-flex-visual-acuity/ [accessed August 2014).
8. http://precision-vision.com/Articles/b-letterchartmeasurements.html [accessed August 2014).
9. Aslam TM, Murray IJ, Lai MY, et al. An assessment of a modern touch-screen tablet computer with reference to core physical characteristics necessary for clinical vision testing. J R Soc Interface 2013;10:20130239.
10. Tahir HJ, Murray IJ, Parry NRA, et al. Optimisation and assessment of three modern touch screen tablet computers for clinical vision testing. PLoS ONE 2014:9:e95074.