The diagnostic properties of a nerve-fiber analyzer in glaucoma: Potential use as a screening or diagnostic tool
Patricia M. Khu, MD, MS, Edgardo U. Dorotheo, MD, Lawrence Tinio, MD, Cynthia P. Cordero, MS, Manuel B. Agulto, MD
SCANNING laser polarimetry (SLP), exemplified by the GDx 400 nerve-fiber analyzer, allows noninvasive quantitative assessment of the retinal nerve-fiber layer (RNFL). Several studies 1-5 showed considerable overlaps in measurements among those suspected with glaucoma and those with early glaucoma. Sensitivities vary from 57% to 82% and specificities from 62% to 92%. 6-7 These differences occurred depending on the cutoff for “abnormal” used. Other studies 1, 7 used logistic regression analysis and discriminant function and identified several GDx parameters that best differentiate normal from glaucomatous eyes. In this study, the diagnostic properties (sensitivity, specificity, predictive value, likelihood ratio) of the GDx 400 in normal and in glaucoma patients were compared with a battery of glaucoma tests employed by glaucoma experts as gold standard. The receiver operating characteristic (ROC) curve was used to illustrate the relationship between sensitivities and specificities of five GDx parameters and the GDx machine.
METHODOLOGY
Patients were recruited from the Eye Referral Center (ERC) and the Glaucoma Section of the Department of Ophthalmology, Philippine General Hospital (PGH) between July 2000 and July 2002. Included in the study
were patients between 30 and 79 years of age with visual acuity of at least 20/40 (6/12) with best correction. Those with significant media opacities that could preclude good scanning images, presence of retinopathy, or high refractive error of greater than –6 diopters were excluded. Only one eye per patient was included in the study. The study complied with the Declaration of Helsinki and was approved by the Ethics Committees of the PGH and the Eye Referral Center. All subjects gave informed consent. Each patient underwent the following examinations: complete eye evaluation, automated threshold perimetry 30-2 (Octopus 101, Bern, Switzerland or Humphrey Field Analyzer I 630, San Leandro, CA, USA), scanning laser polarimetry (GDx 400), optic disc photography (Canon 60UVI fundus camera, Tokyo, Japan). Two glaucoma experts, masked from the GDx results, graded all the eyes included in the study. Eyes were classified as either normal or with glaucoma. The following aided the experts in making the classification:
1. An eye was considered normal if the visual field did not show any characteristic glaucomatous defects on
standard achromatic perimetry (SAP), had an intraocular pressure (IOP) of less than 30 mmHg, had a cup-to disc (CD) ratio of less than or equal to 0.5, and no suspicious glaucomatous damage on the optic-nerve head (ONH).
2. An eye was considered to have glaucoma if any one of the following was present: cupping to the disc margin with associated enlargement of the peripapillary atrophy with or without detectable abnormalities in the visual field on SAP; glaucomatous abnormalities in the ONH such as disc hemorrhage; and abnormalities in the visual field characteristic of glaucoma damage. During the grading sessions, information relating to
each study eye was made available (visual-field printouts, IOP, ocular history and medications but no GDx results). All the available optic-disc photos were projected onto a screen at the same magnification for adequate comparison. The classification was done openly with discussions between the two graders. A consensus was arrived at for the diagnosis of each eye. If the disc cupping was more than 0.5, centrally located, with an intact neuroretinal rim, and no obser vable visual-field defect on SAP, it was classified as normal. Data collected were entered into MS Excel (Microsoft Corporation, Redmond, WA, USA) worksheet and
subjected to ROC curve analyses using Statistical Package for the Social Sciences (SPSS) version 11.0 (SPSS, Inc., Chicago, IL, USA). Two-by-two tables were constructed for five select GDx parameters, which included average thickness (AVE), superior average (SA), inferior average (IA), ellipse average (EA), and ellipse modulation (EM). Their sensitivities, specificities, predictive values, and likelihood ratios were obtained at varying cutoff levels for the presence or absence of glaucoma using Epi Info version 6 (Centers for Disease Control and Prevention, Atlanta, GA, USA ). The GDx number (#)8 represented the overall probability of an eye having glaucoma. It was generated by the machine and derived by integrating all the GDx parameters and characteristics by means of neural network and comparing to an inherent database. Values ranged
from 0 to 100; the higher the number, the higher the probability. Values 0 to 30 were considered normal; 31 to 70 glaucoma suspects; and 71 to 100 with glaucoma. Several two-by-two tables were generated at different cutoff levels for the presence or absence of glaucoma. A ROC curve was constructed to determine the best cutoff level.
RESULTS
Demographic characteristics
A total of 355 patients (144 males, 211 females) were included in the study. Mean age was 58 years. Mean visual acuity was 20/25 (6/7.5) (0.9). Mean IOP was 14.5 mm Hg (Table 1).
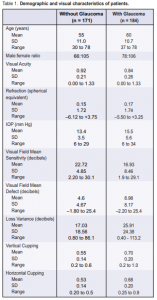
Patients in the glaucoma group were older (p = 0.001), had lower visual acuity (p = 0.003), had abnormalities in the visual field with lower mean sensitivity (p < 0.001), higher mean defect (p < 0.001), and larger loss variance or pattern standard deviation (p < 0.001). Many of those with glaucoma were on medication or had glaucoma surgery.
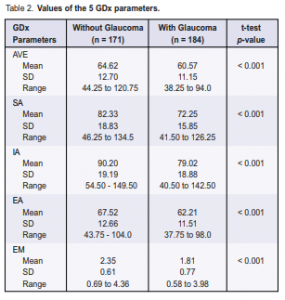
GDx parameters: mean values
The five GDx parameters (Table 2) showed lower mean values in the glaucoma group compared with the normal group (p < 0.001).
Validity analysis
Two-by-two tables were constructed for each GDx parameters and ROC curves were generated to determine
the best cutoff level for the presence or absence of glaucoma. The sensitivities of the five GDx parameters ranged from 62% to 75%, and specificities from 46.8% to 65% (Table 3). The corresponding ROC curves did not show a rapid rise to the upper left corner; instead the curves were closer to the center diagonal line running from lower left to upper right. The positive predictive values ranged from 58.6% to 63.7% and the negative predictive values ranged from 57.1% to 63.6% (Table 3). At best, the GDx parameters were able to predict 60% of those with either a positive or a negative test.
Diagnostic properties of the GDx
The GDx number was the diagnosis generated by the GDx system and this was compared with the diagnosis
given by the glaucoma experts. Different two-by-two tables were generated using several cutoff levels (Table 4). The manufacturer’s recommended cutoff level for glaucoma was GDx number 71. The sensitivity obtained
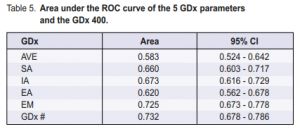
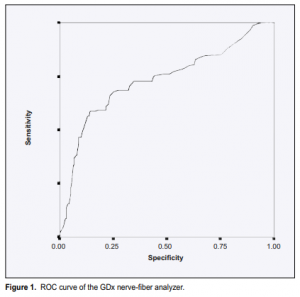
on this level was 45.4% with a specificity of 91.9%. High false-negative errors were present. Lowering the cutoff level to 50 would improve the sensitivity to 67.4% and lower the false-negative errors but would also decrease the specificity to 77.8%. Looking at the ROC curve of the GDx (Figure 1), the point nearest the upper left corner has a sensitivity of approximately 68.7% and a specificity of 70%. This was obtained at a cutoff level of 44. The GDx number, which integrates all the GDx parameters, had the best ROC curve when compared with each of the five GDx parameters studied with an area under the curve of 0.732 (Table 5).
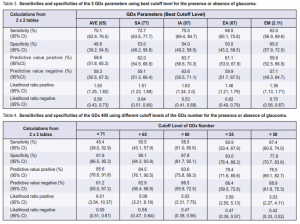
The positive predictive value of the GDx number was much higher than the individual GDx parameters studied. It also had a higher positive likelihood ratio (Table 4).
DISCUSSION
Issues relating to GDx measurements
This study shows that the mean values of the five GDx parameters studied were lower in the glaucoma group than in the normal group. But the separation of the glaucoma from the normal was not clear-cut. Overlap of values was present. The ROC curves generated for the five GDx parameters and the GDx number showed curves that were closer to the diagonal line running from lower left to upper right, indicating that the GDx nerve-fiber analyzer did not adequately discriminate between those with and without the disease. Tests that discriminate well will show that as the sensitivity progressively goes down (the cutoff point is lowered) there is little or no loss in specificity until high levels of sensitivity are achieved. The area under the ROC curve would be much higher and closer to 1. Most overlaps in values were between suspected glaucoma and early glaucoma cases when the study participants were further subdivided into normal, suspected glaucoma,
early, moderate, and advanced glaucoma.9These results were in agreement with other studies 1-5 showing that the GDx had difficulty differentiating suspected glaucoma from early glaucoma.
Issues relating to validity
Validity, or accuracy, is the degree to which the results of a measurement correspond to the true state of the phenomenon being measured. A simple way of looking at the relationship between a test’s results and the true diagnosis is the two-by-two table. The test is considered to be either positive (abnormal) or negative (normal) and the disease is either present or absent. There are four possible interpretations of test results, two of which are correct and two wrong. The test gives the correct answer when it is positive in the presence of disease or negative in the absence of disease. On the other hand, the test will be misleading if it turns out positive, even when the disease is absent (false positive) or negative when the disease is present (false negative). The results
of this study showed that at best the five GDx parameters, when used individually, are able to predict correctly 60% of positive or negative test results. But when the machine is considered as a whole, the positive predictive value can be increased to 77% and the negative predictive value to 69% at a cutoff level of 50. Caution must be exercised in interpreting diagnostic test results. The gold standard used in comparing test results must be known. The choice of a gold standard in assessing the sensitivity and specificity of a new instrument for the diagnosis of glaucoma poses several problems. Each of the tools employed in making the diagnosis of glaucoma involves looking at different aspects of the disease. In evaluating the optic-ner ve head, one looks for the presence of structural damage. In visual-field testing, one looks at the functional damage. Structural damage in the ONH, as exemplified by increased cupping with loss of the neuroretinal rim, corresponds to functional damage in the visual field with characteristic glaucomatous defects. However, early visual-field defects may not be seen on SAP until enough ganglion cells (more than 40%)10 have been damaged, indicating that structural and functional damage in the early stage of the disease is not linear. Studies have shown that structural damage generally precedes functional damage. 10-11 Comparing findings in
the ONH or visual field solely is, therefore, not adequate. When both features were combined and used to make a diagnosis, the sensitivity and specificity rose. Most studies in the last few years incorporated both aspects of the disease in making a diagnosis. Thus, the more appropriate choice of a gold standard by which an instrument can be compared with is to use all available information and tools—a battery of glaucoma tests that the glaucoma expert uses—to make a diagnosis. The glaucoma expert integrates all test results and arrives at the diagnosis of whether glaucoma is present or not. In this study, the consensus grading of two glaucoma experts was used as the gold standard. They graded the optic-disc features and interpreted the visual-field results.
The five GDx parameters generated by the GDx 400 are indices of the “double-hump” profile of the RNFL and are indirect measures of the RNFL thickness using a scale ranging from 0 to 140. How well the five GDx parameters correlate to the true RNFL thickness (measured in microns) is unknown. The considerable overlap in values for the different groups can be due to any or a combination of the following conditions:
1. Incomplete neutralization of the corneal birefringence. The GDx 400 utilized a fixed corneal compensator. It assumes all eyes have a corneal polarization axis of 15 degrees nasally downward and a corneal polarization
magnitude of 60 nm. 12 Recent studies showed that approximately 30% of eyes do not assume this configuration leading to variable results due to incomplete neutralization of the effect of corneal birefringence. 13-14 Structures in the eye that exhibit major birefringence are the RNFL, lens, and the cornea. Incomplete neutralization of the effect of the lens and the cornea can result in increased birefringence that may be incorrectly attributed to that of the RNFL. In some of the eyes in this study, the GDx ner ve-fiber analyzer may be measuring the corneal birefringence in addition to the RNFL birefringence.
2. There is a wide spectrum of glaucoma damage. Structural and functional damages in glaucoma do not
correspond all the time. 10-11 Studies have shown that structural damage precedes functional damage; that it takes about 40 to 50% ganglion-cell loss before repeated functional damage is detected on SAP. 10This discrepancy between structure and function can be seen in the early stage of glaucoma wherein there may already be nervefiber-layer thinning, a structural change, but no visualfield changes yet on SAP. Or in the more advanced glaucoma wherein structural changes are far advanced yet large portions of the visual field may still be intact and vice versa.
3. The normative databases to which the GDx parameters were compared were mostly from multicenter studies done in the United States. The values were largely obtained from Caucasian eyes and may not reflect the normal values for Filipino eyes. The study by Poinoosawmy et al.4 showed age differences in RNFL thickness between normal white patients and Afro-Carribeans but no data for Asians as the number of subjects was too small. Reported sensitivities and specificities of the GDx400 vary depending on the parameters and cutoff points used. Tjon-Fo-Sang and Lemij6 used the 2.5 and 97.5 percentiles for the superior/inferior (S/I) ratio obtained from the retardation graph as the cutoff between normal and glaucoma. They reported sensitivity and specificity greater than 90%. Trible et al.7 used the number of GDx parameters that were abnormal (i.e., 3 or more abnormal parameters considered glaucoma). The study also used the GDx number to denote the probability of abnormality in glaucoma, and had sensitivities of 57% for early, 71% for moderate, and 81% for severe glaucoma when specificity was 89%. Our results are in agreement with the latter lower sensitivities. The GDx number assigned to each study eye by the machine was compared with the diagnosis made by the glaucoma experts. Using the cutoff level of 71, the sensitivity of the analyzer was only 45.4%. This means that the GDx system was able to detect glaucoma in less than half of the patients even though it showed a specificity of almost 92%. If the GDx would be used as a diagnostic tool to detect glaucoma, higher sensitivities are required. To decrease false-negative errors and, therefore, increase the sensitivity at the expense of specificity, the cutoff level of the GDx number may be decreased (Table 4). If the cutoff level were lowered by 10 units, the sensitivity would increase by 13% to 58.5% with only a slight decrease in specificity (87.8%). If the cutoff level were lowered by 20 units, the sensitivity increased to 67.4% and the specificity lowered to 77.8%. There will be more false-positive errors at the expense of increasing the sensitivity level to detect early cases. In glaucoma, detecting the disease early with continued monitoring means a decreased chance of blindness over the long term. A choice has to be made whether to catch all glaucoma cases early by lowering the sensitivity (when used as a screening tool), or to maintain good specificity (when used as a diagnostic tool). This choice will depend on the prevalence of glaucoma in the setting where the GDx machine is to be used. Positive results, even for a very specific test, when applied to patients with a low likelihood of having the disease, will be largely false positives. Similarly, negative results even for a very sensitive test, when applied to patients with a high chance of having the disease, are likely to be false negatives. Thus, the more sensitive a test is, the better will be its negative predictive value, and the more confident the clinician can be that a patient with a negative test result does not have the disease being sought. Conversely, the more specific the test is, the better will be its positive predictive value. One also has to consider the effect of labeling a person “glaucoma suspect” or “with glaucoma,” both for economic (cost of follow-up visits and the different glaucom tests) and psychological reasons (the stigma of the disease and fear of blindness). Once the diagnosis has been made, the question of when to treat comes in. Management of the condition is lifelong and may involve long-term use of expensive glaucoma medications. Hence, in a diagnostic tool, a higher specificity over sensitivity is preferable since falsely labeling a patient with glaucoma has long-term consequences.
Limitations of the study
Gold standard. Standard achromatic perimetry may not be sensitive enough to detect early glaucoma damage.
Newer perimetric tests, such as the short wavelength automated perimetry (SWAP)15-16 and the frequency
doubling perimetry,17 have been reported to detect early glaucomatous changes five years before they were evident in SAP. They may replace SAP and if so would certainly be included among the gold standards in detecting the presence or absence of glaucoma. Variable corneal compensator. The GDx 400 used a fixed
corneal compensator in correcting for the effect of corneal birefringence. For eyes with corneal polarization axis and magnitude different from that of the machine, increased birefringence may occur that may incorrectly be attributed to that of the RNFL. Newer version of the SLP (GDx Access, Laser Diagnostic Technologies, San Diego, CA, USA) that can neutralize the corneal polarization axis for each eye using continuous corneal compensator,13 will improve the ability of this technology in detecting early glaucoma. Normative values for Filipino eyes. Obtaining normative values specific for Filipino eyes whereby eyes tested can be compared with will certainly be advantageous since there may be racial differences in the thickness of normal RNFL. Currently, the GDx 400 nerve-fiber analyzer is primarily used as a screening tool to detect the presence or absence of glaucoma. Its accuracy can be improved with use of the continuous corneal compensator to correct for the effect of corneal and lens birefringence. The newer version of the machine is likely to have more precise measurements with less overlap of values, leading to its use as a diagnostic tool to detect early glaucoma.
1. Weinreb RN, Zangwill L, Berry CC, et al. Detection of glaucoma with scanning laser polarimetry. Arch Ophthalmol 1998; 116: 1583-1589.
2. Weinreb RN, Dreher AW, Coleman A, et al. Histopathologic validation of Fourierellipsometry measurements of retinal nerve- fiber layer thickness. Arch Ophthalmol 1990; 108: 557-560.
3. Weinreb RN, Shakiba S, Zangwill L. Scanning laser polarimetry to measure the nerve-fiber layer of normal and glaucomatous eyes. Am J Ophthalmol 1995; 119: 627-636.
4. Poinoosawmy D, Fontana L, Wu JX, et al. Variation of nerve-fiber-layer thickness measurements with age and ethnicity by scanning laser polarimetry. Br J Ophthalmol 1997; 81: 350-354.
5. Weinreb RN, Shakiba S, Sample PA, et al. Association between quantitative nervefiber-layer measurement and visual-field loss in glaucoma. Am J Ophthalmol 1995; 120: 732-738.
6. Tjon-Fo-Sang MJ, Lemij HG. The sensitivity and specificity of nerve-fiber-layer measurements in glaucoma as determined with scanning laser polarimetry. Am J Ophthalmol 1997; 123: 62-69.
7. Trible JR, Schultz RO, Robinson JC, Rothe TL. Accuracy of scanning laser polarimetry in the diagnosis of glaucoma. Arch Ophthalmol 1999; 117: 1298-1304.
8. GDx Nerve-Fiber Analyzer Instruction Manual, San Diego, CA, 1994.
9. Khu PM. The diagnostic properties of the scanning laser polarimetry in glaucoma. Masters thesis, University of the Philippines Manila; May 2003.
10. Quigley HA, Addicks EM, Green WR. Optic-nerve damage in human glaucoma. III. Quantitative correlation of nerve-fiber loss and visual-field defect in glaucoma, ischemic optic neuropathy, papilledema, and toxic neuropathy. Arch Ophthalmol 1982; 100: 135-146.
11. Sommer A, Katz J, Quigley HA, et al. Clinically detectable nerve-fiber-layer atrophy precedes the onset of glaucomatous field loss. Arch Ophthalmol 1991;109:77-83.
12. Weinreb RN, Bowd C, Greenfield DS, Zangwill LM. Measurement of the magnitude and axis of corneal polarization with scanning laser polarimetry. Arch Ophthalmol 2002; 120: 901-906.
13. Zhou Q, Weinreb RN. Individualized compensation of anterior segment birefringence during scanning laser polarimetry. Invest Ophthalmol Vis Sci 2002;
43: 2221-2228.
14. Greenfield DS, Knighton RW, Feuer WJ, et al. Correction for corneal polarization axis improves the discriminating power of scanning laser polarimetry. Am J Ophthalmol 2002; 134: 27-33.
15. Polo VP, Larrosa MJ, Pinilla I, et al. Predictive value of short-wavelength automated perimetry: a 3-year follow-up study. Ophthalmology 2002; 109: 761-765.
16. Polo V, Abecia E, Pablo LE, et al. Short-wavelength automated perimetry and retinal nerve-fiber-layer evaluation in suspected cases of glaucoma. Arch Ophthalmol 1998; 116: 1295-1298.
17. Bowd C, Zangwill LM, Berry CC, et al. Detecting early glaucoma by assessment of retinal nerve-fiber-layer thickness and visual function. Invest Ophthalmol Vis Sci 2001; 42: 1993-2003.
The author thanks Dr. Alejandro de Leon, Dr. Rossina Ramirez, and Dr. Corazon Ngelangel for their invaluable input to this study.