Reliability analyses of the GDx nerve-fiber analyzer
Patricia M. Khu, MD, MS, Edgardo U. Dorotheo, MD, Lawrence Tinio, MD, Cynthia P. Cordero, MS, Manuel B. Agulto, MD
THE SCANNING laser polarimetry (SLP), exemplified by the GDx 400 (Laser Diagnostic Technologies, San
Diego, CA, USA) allows noninvasive quantitative assessment of the retinal nerve-fiber layer (RNFL). This instrument uses a diode laser in the near infrared (780 nm) to obtain RNFL thickness measurements at 65,536 retinal points in a 15-by-15-degree grid centered on the opticnerve head (ONH).1-2 The polarized light emitted passes through the RNFL, undergoes a phase shift that splits into two beams of different velocities. A detector in the instrument measures the degree of phase shift. This measurement, the difference in velocity, is called retardation and is proportional to the thickness of the RNFL through which the incident light has passed. The scanning laser polarimeter uses a mathematical algorithm developed by the manufacturer eliminating the effect of the cornea and the lens as the polarized light passes through them. The measurement obtained is a measure of relative nerve-fiberlayer thickness. The correlation between retardation measurements and RNFL thickness has been shown previously in experiments with histopathological measurements in postmortem human and monkey eyes.3
In recent years, several studies have validated the principle of SLP; the normal optic nerves have a typical doublehump configuration when the profiles of the RNFL surface height were plotted two dimensionally. 4-5 The thickest areas of the nerve-fiber bundle are located superiorly and inferiorly, whereas the temporal areas tend to be lowest because of slight tilting of the ONH. Glaucomatous atrophy is indicated as a loss of the double-hump pattern with flattening and lowering of the RNFL surface profile.
Repeatability studies of the SLP were done on measurements taken at three different peripapillary locations. 6-7 Coefficient of variation ranged from 3.6 to 4.1% in normal eyes and 5.7 to 10.2% in glaucomatous eyes. Precision was calculated up to 5 microns. Small sample size and failure to stratify the glaucoma group according to severity were evident. Whether the measurements were affected by thedifferent operators who took the scanning images was not determined. The ultimate usefulness of objective measurements
using sophisticated tools still requires knowing the amount of variability inherent in their use. When the amount of “noise” present in the acquisition of these images is known, any change that is beyond the “noise level” would be considered related to the disease process. The usefulness of an instrument is to detect not only the presence or absence of glaucoma, but eventually to measure the progression of the disease process accurately and reliably over the long term. Thus, this study determined the reliability of the GDx 400 nerve-fiber analyzer. Specifically, we determined the within-operator (intra-observer) and between-operators
(inter-observer) variability, as well as the within-session (same visit) and between-sessions (different visits) variability of the GDx in a sample of normal and glaucoma patients.
METHODOLOGY
This is a cross-sectional study among a sample of individuals with and without glaucoma. RNFL measurements
were obtained for each group by two operators on the same day (session 1) and on another day (session 2). Reliability measures for five GDx parameters were obtained. Patients seen at the Glaucoma Section of the Department of Ophthalmology of the Philippine General Hospital (PGH) and at the Eye Referral Center (ERC) were recruited based on the following criteria: age 30 to 79 years and visual acuity of at least 20/40 (6/12) or better with best correction. Those with significant media opacities as to preclude good scanning images, presence of retinopathy, or high refractive error of greater than minus 6 diopters were excluded. Only one eye per patient was included in the study. The study was conducted according to the tenets of the Declaration of Helsinki. All subjects gave informed consent. The study was also approved by the Ethics Committees of
the PGH, the University of the Philippines College of Medicine, and the Eye Referral Center. Each patient underwent complete eye evaluation, automated threshold perimetry 30-2 (Octopus 101, Bern, Switzerland or Humphrey HFA I 630, San Leandro, CA, USA), scanning laser polarimetry (GDx 400), optic-disc photography (Canon 60UVI fundus camera, Tokyo,
Japan).
SLP measurements
The patient faced the optoelectronic scan head of the GDx 400 with the pupil in undilated state, and fixated on an external target with the eye not being examined. After the operator has properly focused a ring-shaped target onto the iris and centered the target on the patient’s pupil, a live fundus image was seen on the liquid-crystal-display monitor. The intensity of the illuminating laser light was adjusted to achieve appropriate fundus illumination. A complete scan consisting of 65,536 individual retinal locations (256 x 256 pixels) with a field of view of 15 degrees was obtained. The acquisition time was 0.7 second per image. Immediately after acquiring and storing the data in a personal computer, a computer algorithm calculated the amount of retardation at each measured retinal position and expressed it as the RNFL thickness. A retardation map described the change in the state of polarization (retardation) at each location within the field of view. Processing time was approximately 15 seconds. The RNFL images were obtained by two trained and experienced operators. They were masked as to the status of the study eye. At the first session, two images were obtained by each of the operators, total of four images for the study eye. Within one week, the second set of images was obtained by the same two operators.
The RNFL measurements stored in the computer were recalled for analyses. The retardation (in degrees) was
measured within a 10-pixel-wide band located concentrically with the disc margin at 1.7 disc diameters. The
optic-disc margin was approximated by a circle or ellipse placed around the inner margin of the peripapillary scleral ring by the experienced operator. The retardation map was divided into four retinal regions: a superior and an inferior region of 120 degrees each, a temporal region of 70 degrees, and a nasal region of 50 degrees. Mean absolute retardation was calculated for the overall peripapillary retina (360o), superior (180o) and inferior retina (180o), temporal (70o) and nasal (50o) retina. Several GDx parameters were calculated by the computer. For the purpose of this study, the reliability of the following five parameters that give the best sensitivity based on previous studies8 were evaluated:
1. Average thickness (AVE) – the average of all of the thickness measurements in the image;
2. Superior average (SA) – the average of the 1,500 thickest points in the superior quadrant;
3. Inferior average (IA) – the average of the 1,500 thickest points in the inferior quadrant;
4. Ellipse average (EA) – the average of the thickness measurements along the ellipse;
5. Ellipse modulation (EM) – the difference between the thickest and thinnest areas along the ellipse.
Main outcome measures
The reliability of each of the five GDx parameters was determined for the two operators who took the RNFL images. Within-operator (intra-observer) (comparison of images taken by the same operator of the same eye) and between-operators (inter-observer) (comparison of images taken by different operators of the same eye) reliability measures were obtained. Comparison of images taken at two different sessions within one week where there is no expected clinical change was determined. Within-session (comparison of images of the same eye taken on the same visit) and between-sessions (comparison of images of the same eye taken at two different visits) reliability measures were obtained. Intraclass correlation coefficients were obtained to assess the agreement of RNFL measurements under each of the following conditions:
a. within-operator (intra-observer) within-session
b. within-operator (intra-observer) between-sessions
c. between-operators (inter-observer) within-session
d. between-operators (inter-observer) between sessions
Statistical analysis
The intraclass correlation coefficient ρ is defined by the following equation:
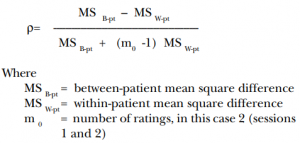
The mean square difference is the sum of the squares divided by the degrees of freedom. ρ estimates the
percentage of total variance due to the between-patient component. A high value of ρ suggests the “noise” of the measurement method is low relative to the total variance in the population.9

RESULTS
Between July 2000 and July 2002, 355 patients (144 males, 211 females) were recruited into the study. The mean age was 58 years. Mean visual acuity was 20/25 (6/7.5)(0.9). Mean IOP was 14.5 mm Hg. The characteristics of the included patients in each group are shown in Table 1. Only 227 (64%) patients came back for repeat RNFL measurements.
Reliability analysis
The intraclass correlation coefficient ρ, which measures the consistency or agreement of values within cases, was excellent for the five parameters for within-operator within-session reliability measures (Table 2) and for withinoperator between-sessions reliability measures (Table 3). The EM parameter has slightly lower ρ compared with the other parameters. Good intraclass correlation coefficients (ρ) were obtained for all GDx parameters for between-operators within-session reliability measures (Table 4). The EM parameter has slightly lower ρ compared with the other parameters. The inter-observer same session reliability measures were also higher for the second session than the first session. Between-operators between-sessions reliability measures showed good ρ for all parameters with all values above 0.8 (Table 5). This means that repeated measurements taken by different operators on different days for the same patient were reliable.
DISCUSSION
Since the GDx nerve-fiber analyzer was introduced, it has been promoted as a screening tool for the detection
of glaucoma. Several studies,10-13 however, showed considerable overlap of values of the GDx measurements such that there was no clear-cut separation between normal and glaucoma eyes. More recent studies
8, 11-14 showed lower sensitivity and specificity values for the GDx analyzer than originally demonstrated.15 Recent validation studies11, 16 indicated that it was more suited for documenting established glaucoma rather than for detecting early glaucoma. It is for this reason that repeatability studies are needed to determine if the GDx 400 can monitor glaucoma reliably over the long term. Since repeat measures are involved, it is essential that we know the amount of variability present that is related to the process of taking the measurements. Variability in repeat measurements can occur when different operators take the images or when images are taken at different sessions even by the same operator. Our results showed excellent ρ for the five GDx parameters when images were taken by the same operator at the same session (Table 2) or at different sessions (Table 3).

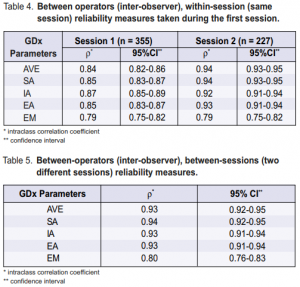
Excellent ρ values were also obtained by different operators at the same session (Table 4) and at different sessions (Table5). Almost all values were 0.8 or better and considered excellent.9 Hence, the GDx 400 showed that it can reliably take RNFL images in the same eye by different operators at different sessions. Learning effect can also improve the reliability measures; measurements taken during the second session, within one week from the first sessio where there is no likelihood of a clinical change in the eye, have higher ρ than those of the first session (Table 4). During the first session, each patient underwent multiple tests that lasted two and one half hours. The RNFL measurements were obtained toward the end of the session and patients already showed signs of fatigue. The second session, moreover, lasted less than one hour and the only test done was a repeat RNFL measurements. Thus, one way to improve the reliability of the GDx measurements is to ensure that patients know what the procedure involves. One of the recommendations of the Association of International Glaucoma Societies (AIGS) is using digital imaging as a clinical tool to enhance and facilitate assessment of the optic nerve and RNFL in the management of glaucoma.17 Moreover, automated analyses of the results should use appropriate databases in identifying abnormalities consistent with glaucoma. In recent years, different imaging techniques 5, 6, 8, 10, 18-21 capable of documenting and quantifying the optic-nerve-head features and the RNFL were developed. These imaging technologies may be complementary and may detect different abnormal features in the same patients.17 Hence, they should not probably be compared against each other; rather, they should be used to enhance the clinical decision-making of the ophthalmologist in monitoring the disease process. Good repeatability of measurements is a prerequisite for following any change in measurement over time. The good intraclass correlation coefficients obtained for the nerve-fiber analyzer for different operators and at different sessions showed that this machine can be used for repeat measures over time to determine any progression of the disease. Variations in measures can be obtained in the same eye using the same instrument and by the same operator. These variations are called fluctuations and can be found in any eye being measured. Some common examples are the short- and long-term fluctuations found in visual-field tests. For the different GDx parameters, there are also fluctuations in measurements over time. These fluctuations usually consist of the variability measured with regard to the different operators and different sessions. For a change to be considered “real,” the normal fluctuations in measurements must be exceeded. In this study, if fluctuations in measurements should exceed 20% from baseline, the possibility of disease progression should be considered. Future studies on the long-term use of the GDx machine with follow-up GDx measurements will provide answers as to the amount of “noise” that must be exceeded to consider the change in measurements as progression of the disease. Possible sources of bias in this study include patient selection and performance bias. Patients included in the study were those who could undergo multiple eye tests for several hours and, therefore, tended to be much younger
(mean age of 58 years) than the general population of elderly where most established glaucoma is found. In
addition, the older population has more difficulty performing reliable visual-field tests and is also expected to do less well at the GDx 400. The reliability of the GDx test results, however, is influenced less by patient’s
cooperation, as the testing procedure is much shorter and involves only good fixation. In our study, there was no difference in the reliability measures of the normal (mean age of 55 years) and the glaucoma (mean age of 60 years) patients. All the glaucoma patients in this study have 20/40 (6/12) or better vision. Patients with advanced glaucoma and poorer visual acuity may do less well with greater variability than those shown in this study. Caution in the interpretation of follow-up GDx measurements in the elderly must be exercised even in the presence of variability greater than 20% of baseline since these may still be attributed to the patient. Operators who took the measurements in this study were likely to be giving more time and effort in the acquisition of the images more than they normally do for clinic patients. This study did not look into the variability of using other GDx machines of the same model (variability between machines) nor of a different model such as the GDx Access (an improved version). 22-23 Prudence dictates that adequate baseline should be obtained for all patients. The optimum number of repeat measurements as baseline has not been determined and is beyond the scope of this study. In the long-term follow-up of glaucoma patients, whenever there is a change in the GDx machine, new baseline studies should be obtained. In summary, the GDx 400 nerve-fiber analyzer has good reliability and can be used to monitor changes in the RNFL thickness over time. Change in measurements exceeding 20% from baseline should be considered as possible progression.
1. Dreher AW, Reiter K. Retinal laser ellipsometry: a new method for measuring the retinal nerve-fiber-layer thickness distribution. Clin Vision Sci 1992; 7: 481-486.
2. Dreher AW, Reiter K. Scanning laser polarimetry of the retinal nerve-fiber layer. In: Goldstein DH, Chipman RA, eds: Polarization analysis and measurement. Proc SPIE 1992; 1746: 34-40.
3. Weinreb RN, Dreher AW, Coleman A, et al. Histopathologic validation of Fourierellipsometry measurements of retinal nerve-fiber-layer thickness. Arch Ophthalmol 1990; 108: 557-560.
4. Caprioli J. The contour of the juxtapapillary nerve-fiber layer in glaucoma. Ophthalmology 1990; 97: 358-365.
5. Weinreb RN, Shakiba S, Zangwill L. Scanning laser polarimetry to measure the nerve-fiber layer of normal and glaucomatous eyes. Am J Ophthalmol 1995; 119: 627-636.
6. Chi QM, Tomita G, Inazumi K, et al. Evaluation of the effect of aging on the retinal nerve-fiber-layer thickness using scanning laser polarimetry. J Glaucoma 1995; 4: 406-413.
7. Hoh ST, Ishikawa H, Greenfield DS, at al. Scanning laser polarimetry: reproducibility of peripapillary nerve-fiber-layer thickness measurements. Invest Ophthalmol Vis Sci 1997; 38(Suppl): 3914.
8. Weinreb RN, Zangwill L, Berry CC, et al. Detection of glaucoma with scanning laser polarimetry. Arch Ophthalmol 1998; 116: 1583-1589.
9. Snedecor GW, Cochran WG. Statistical methods. 8th ed. Ames: Iowa State University Press, 1989.
10. Choplin NT, Lundy DC, Dreher AW. Differentiating patients with glaucoma from glaucoma suspects and normal subjects by nerve-fiber-layer assessment with scanning laser polarimetry. Ophthalmology 1998; 105: 2068-2076.
11. Trible JR, Schultz RO, Robinson JC, Rothe TL. Accuracy of scanning laser polarimetry in the diagnosis of glaucoma. Arch Ophthalmol 1999; 117: 1298-1304.
12. Nicolela MT, Martinez-Bello C, Morrison CA, et al. Scanning laser polarimetry in a selected group of patients with glaucoma and normal controls. Am J Ophthalmol 2001; 132: 845-854.
13. Sanchez-Galeana C, Bowd C, Blumenthal EZ, et al. Using optical imaging summary data to detect glaucoma. Ophthalmology 2001; 108: 1812-18.
14. Choplin NT, Lundy DC. The sensitivity and specificity of scanning laser polarimetry in the detection of glaucoma in a clinical setting. Ophthalmology 2001; 108: 899-904.
15. Tjon-Fo-Sang MJ, Lemij HG. The sensitivity and specificity of nerve-fiber-layer
measurements in glaucoma as determined with scanning laser polarimetry. Am J Ophthalmol 1997; 123: 62-69.
16. Khu PM. The diagnostic properties of the scanning laser polarimetry in glaucoma. Masters thesis, University of the Philippines Manila, May 2003.
17. Weinreb RN, Greve EL. Glaucoma diagnosis: structure and function. Netherlands: Kugler Publications, 2004.
18. Zangwill LM, Bowd C, Berry CC, et al. Discriminating between normal and glaucomatous eyes using the Heidelberg retina tomography, GDx nerve-fiber analyzer, and optical coherence tomography. Arch Ophthalmol 2001; 119: 985- 993.
19. Broadway DC, Drance SM, Parfitt CM, Mikelberg FS. The ability of scanning laser ophthalmoscopy to identify various glaucomatous optic-disc appearances. Am J Ophthalmol 1998; 125: 593-604.
20. Bowd C, Weinreb RN, Williams JM, Zangwill LM. The retinal nerve-fiber-layer thickness in ocular hypertensive, normal, and glaucomatous eyes with optical
coherence tomography. Arch Ophthalmol 2000; 118: 22-26.
21. Zangwill LM, Williams JM Berry CC, et al. Comparison of optical coherence tomography and nerve-fiber-layer photography for detection of nerve-fiber-layer damage in glaucoma. Ophthalmology 2000; 107: 1309-1315.
22. Zhou Q, Weinreb N. Individualized compensation of anterior segment birefringence during scanning laser polarimetry. Invest Ophthalmol Vis Sci 2002; 43: 2221-2228.
23. Greenfield DS, Knighton RW, Feuer WJ, et al. Correction for corneal polarization axis improves the discriminating power of scanning laser polarimetry. Am J Ophthalmol 2002; 134: 27-33.
The author thanks Mr. Edgar Q. Buagas, Dr. Roland Puaben, and Ms. Evangeline Marion Abesamis for their invaluable services to the project.