Comparison of Intraocular Lens Calculation Formulas for Phacoemulsification after Corneal Refractive Surgery in Asian Eyes
Cris Martin Jacoba, MD, DPBO1, Mary Ellen Sy, MD, DPBO2, Isa Mulingbayan Jacoba, MD3
1 Beetham Eye Institute, Joslin Diabetes Center, Harvard Department of Ophthalmology, Boston, MA, USA
2 American Eye Center, Mandaluyong, Philippines
3 University of the East Ramon Magsaysay Medical Center, Quezon City, Philippines
Correspondence: Cris Martin Jacoba, MD, DPBO One Joslin Place, Boston, MA, USA. 02215
e-mail: CrisMartin.Jacoba@joslin.harvard.edu
Disclosure: The authors report no conflicts of interest.
In patients with a history of previous corneal refractive surgery, computing for the correct power of the intraocular lens (IOL) prior to a planned phacoemulsification is clinically challenging. Traditional lens calculation formulas among these patients are inaccurate because of 3 major factors. These factors include the incorrect measurement of corneal curvature with standard keratometry, incorrect calculation of effective lens position (ELP), and the change in relationship between the anterior and posterior surface of the cornea, making the standard refractive index of the cornea (1.3375) inaccurate.1,2 The frequent refractive outcome is hyperopia, which is unacceptable in the modern era when benchmark standards for refractive outcomes after cataract surgery have been established.3 The purpose of this study is to compare the different formulas available to compute the IOL power for phacoemulsification after Laser in-situ Keratomileusis (LASIK) and Photo-refractive Keratectomy (PRK). The online power calculator of the American Society of Cataract and Refractive Surgery (ASCRS) was used. Previous studies on this topic in an Asian population have analyzed the accuracy of specific formula such as the Haigis-L, but none have done a comprehensive comparison among the number of different formulas available with the ASCRS online calculator.4
MATERIALS AND METHODS
This was a retrospective study that was conducted at 2 clinics of an ambulatory surgical eye center. Asian patients with prior LASIK or PRK who underwent phacoemulsification with IOL implantation between January 2013 and July 2018 and had manifest refraction (MR) between 3 weeks to 3 months after phacoemulsification were included in the study. This minimum period of 3 weeks was based on the stability of post-operative refraction after phacoemulsification with a small temporal clear corneal incision.5-7 Eyes that had complications during or after phacoemulsification (ex: posterior capsule rupture, postoperative IOL exchange), history of enhancements, hyperopic axial length <24 mm, history of intraocular disease, ocular trauma, other ocular surgeries, or had corrected distance visual acuity (CDVA) of worse than 20/32 after phacoemulsification were excluded.8
Phacoemulsification and IOL implantation were performed by 1 of 7 experienced eye surgeons. Preoperative biometry was carried out using an IOL Master 700 (Carl Zeiss Meditec AG, Jena, Germany) and Lenstar LS900 (Haag-Streit AG, Koeniz, Switzerland). Optimized A-constants for each surgeon and IOL type were taken from the eye center database or from the User Group for Laser Interference Biometry (ULIB).9 Preoperative data were inputted in the ASCRS IOL power calculator, an internetbased module that compiles the different calculation methods available for eyes post-corneal refractive surgery. Patients were implanted with monofocal or multifocal IOLs from Alcon Surgical (Fort Worth, TX, USA) or Carl Zeiss Meditec AG (Jena, Germany). Phacoemulsification was done using a temporal 2.2 mm clear corneal incision with implantation of the IOL within the capsular bag. Target postoperative refraction was based on the surgeon’s clinical judgement.
The following de-identified data were collected from the medical records: age (at time of refractive surgery and phacoemulsification), gender, procedure, surgeon, refraction (prior to refractive surgery, prior to and after phacoemulsification), axial length, lens thickness, anterior chamber depth, biometry machine used, keratometry (prior to refractive surgery and phacoemulsification), IOL power and type, femtosecond laser use, and target refraction. Eyes were classified as either high myopes (axial length ≥26.5 mm) or low myopes (axial length ≥24 mm and <26.5 mm).8
To compute for the IOL prediction error (PE), MR after phacoemulsification was determined. The predicted IOL power for each formula is determined by using the manifest refraction spherical equivalent (MRSE) after phacoemulsification as target refraction in the ASCRS online calculator. The predicted IOL power is subtracted from the actual IOL power implanted to obtain the IOL PE. A positive value indicates that the predicted power is lower than the actual IOL power implanted and would leave the patient hyperopic. To compute for the refractive prediction error as detailed by Feiz et al. and later adopted by other authors, the calculation was that 1.00 diopter (D) of IOL PE results in 0.70 D of refractive error at the spectacle plane.10, 11
The following IOL calculation formulas, available with the ASCRS online calculator, were compared:
Shammas Formula. This formula calculates the IOL power by adjusting the measured post-LASIK/PRK keratometry values.12
Haigis-L Formula. This formula modifies the measured corneal radius of curvature of the biometry based on regression analysis, and then calculates IOL power using the regular Haigis formula.13
Barrett True-K and Barrett True-K No History. A recently developed formula with 2 versions for eyes post-corneal refractive surgery: one is based on historical data showing the refractive change created by the laser surgery (“True-K”) while the other version relies only on the biometric data that is collected when he patient presents for cataract surgery (“True-K No History”).14, 15
ASCRS Average IOL power No History, and with ΔMR. The ASCRS online calculator reports an average value for all the formulas generated, which in this study includes the Haigis-L, Shammas, and Barrett True-K/True-K No History. Two independent values for the ASCRS average were analyzed, one that includes the historical data and change in manifest refraction before and after refractive surgery, (“ASCRS Average IOL power with ΔMR”) and one that relies exclusively on the biometric data prior to phacoemulsification (“ASCRS Average IOL power No History”).
Statistical Methods
Descriptive statistics was used to summarize the demographic and clinical characteristics of the patients. Frequency and proportion were used for categorical variables, median and IQR for nonnormally distributed continuous variables, and mean and SD for normally distributed continuous variables. Shapiro-Wilk test for normality was used to check for the distribution of the data. To assess if the mean arithmetic IOL PEs produced by various methods were significantly different from zero, one-sample T-test was used. The variances of mean arithmetic IOL PEs were tested using the F-test for variances to assess the consistency of the prediction performance by different methods. One-way ANOVA test was used to compare the mean arithmetic IOL PEs using the different formulas. Nonparametric method Kruskal-Wallis and Wilcoxon test was used to compare the absolute refractive PEs using different formulas and category of correction. McNemar test was performed to compare percentage of eyes within 0.5, 1.0, and 2.0 D of refractive PEs. Odds ratio and corresponding 95% confidence intervals from binary logistic regression were computed to determine significant predictors for hitting thetarget within 0.5 D. Missing variables were neither replaced nor estimated. The Bonferroni correction was applied for multiple tests. The STATA/SE 13.1 for Windows/Macintosh was used for statistical analysis and a P<0.05 was considered statistically significant.
RESULTS
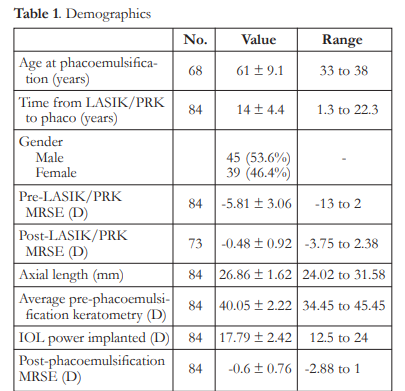
Eighty-four (84) eyes of 68 patients were included in the study. Mean age at time of phacoemulsification was 61 ± 9.1 years, while mean interval from corneal refractive surgery to phacoemulsification was 14 ± 4.4 years. Seventy-three (73) eyes had pre- and post-LASIK/PRK manifest refraction available (Table 1).
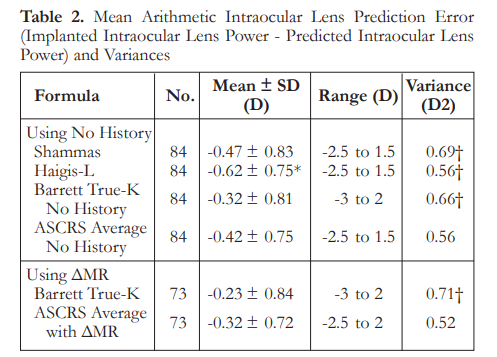
The mean IOL PEs ranged from -0.23 to – 0.62 D and were significantly different from zero (p<0.05). There were no significant differences among the formulas, except for the Haigis-L that
had a mean IOL PE significantly higher than the Barrett True-K mean IOL PE (p<0.001). Variances of IOL PE ranged from 0.52 to 0.71 D. The variances of the Shammas, Haigis-L, and Barrett formulas were significantly higher than the variance of the ASCRS average with ΔMR (p<0.05)
(Table 2). Box plot of the different IOL PEs show that formulas using historical methods have a narrower interquartile range, while the Barrett formulas showed above average variance, with predictions resulting in up to 3 D of myopia and 2 D of hyperopia (Figure 1).

The median refractive PEs ranged from 0.35 to 0.53 D. There were no significant differences in median refractive PEs among the formulas, except for Haigis-L that was significantly higher than the ASCRS average with ΔMR (p<0.001). The ASCRS average with ΔMR had a significantly larger percentage of eyes within ±0.5 D than all other formulas (p<0.05) (Table 3).

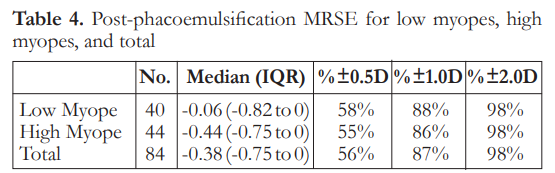
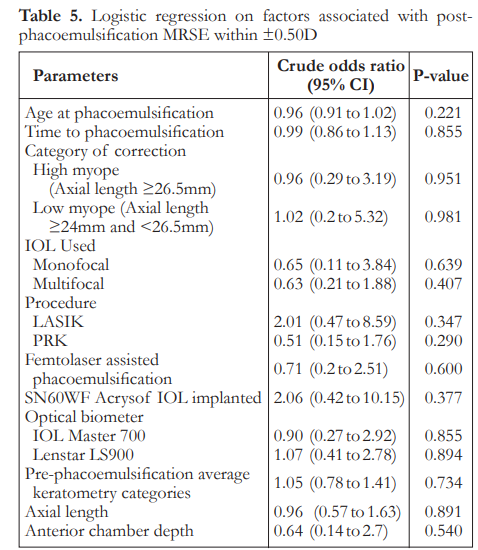
The median post-phacoemulsification MRSE was -0.06 in low myopes and -0.44 in high myopes. There was no significant difference between the two groups on refractive outcomes (Table 4). Logistic regression analysis showed that there was no significant factor associated with post-phaco MRSE within ±0.50 D (Table 5).
DISCUSSION
The mean IOL prediction errors of each formula show that there is a trend towards more myopic results, and all are still statistically significantly different from zero. The trend for postoperative myopia is likely due to surgeon preference in choosing a slightly higher IOL power among the recommendations of the ASCRS online calculator, as postoperative myopia is preferred to hyperopia. Moreover, with the IOL PEs still significantly different from zero, it shows that accuracy towards target refraction can still be significantly improved.
The formula with the lowest overall IOL PE is the Barrett True-K at -0.23 D, however its variance is the highest among all methods. For methods with no history, the Barrett True-K No History has the lowest IOL PE at -0.32 D; however the variance, again, is one of the highest among the no history methods. Overall, evaluation of formulas may have more to do with variance, as the IOL PEs may be accounted for through adjustments in target refraction or IOL constant optimization. In comparison, a high variance negatively affects the consistency of results for an individual patient and may result in higher amounts of unintended myopia or hyperopia. This is consistent with the results shown in the Figure 1 of the refractive PE boxplot, with the Barrett formulas showing up to 3 D myopia and 2 D hyperopia in individual cases, the highest errors among the dataset. Moreover, using the Barrett True-K as the standard with the lowest IOL PE and comparing it to the other formulas, only the Haigis-L shows a statistically significant increase in IOL PE (p<0.001). Regarding variance, the two ASCRS formulas are the lowest, with other formulas showing a statistically significant increase (p<0.05).
The median refractive PE is similar among all formulas at 0.35 D, except for the Haigis-L which is higher at 0.53 D. Using the ASCRS average with ΔMR as the standard with the lowest refractive PE, only the Haigis-L showed a statistically significant increase in refractive PE. The ASCRS average with ΔMR had a significantly larger percentage of eyes within ±0.5 D than the all other formulas (p<0.05). The percentage of eyes within 0.5 and 1 D of target refraction is one of the best markers for the quality of a cataract service, and the UK National Health Service (NHS) has established a benchmark standard of 55% of patients within 0.5 D and 85% of patients within 1 D.3 For the different IOL formulas only the Haigis-L does not perform up to this standard, with only 50% of eyes within 0.5 D of target. The ASCRS average with ΔMR has the highest percentage of eyes within 0.5 and 1 D of target, at 73% and 90% respectively.
Comparing these results to other published studies, in a retrospective case series of 88 eyes with prior myopic LASIK/PRK and subsequent cataract surgery, Barrett et al. used the ASCRS calculator for comparison of IOL formulas and showed that the Barrett True-K formula had a significantly smaller median absolute refractive PE at 0.43 D than all other formulas except the Masket formula.16 Barrett True-K also had a variance of 0.31 or 0.41, statistically smaller compared to the Wang-Koch-Maloney (WKM), Shammas and Haigis-L (p<0.05), and a greater percentage of eyes within 0.5 D of predicted refractive PE compared with the adjusted Atlas, Masket and modified Masket formulas (p<0.05). In our study, all formulas had a median refractive PE at 0.35 D, aside from the Haigis-L at 0.53 D. However, the difference is in the level of variance, as in our study the Barrett True-K formulas had among the highest variance at 0.71 D and 0.66 D, which was statistically higher than the ASCRS average with ΔMR at 0.52 D. An elevated variance may compromise refractive outcomes as consistency cannot be reliably achieved.
Regarding the refractive outcomes with subgroup analysis on low myopes and high myopes, overall there is a slight trend towards myopia. There is no significant difference among the three classifications regarding postoperative MRSE. Overall results show that 56% of eyes achieved refraction within 0.5 D of target refraction. These outcomes are at par with the refractive benchmarks of the NHS, however more recent studies recommending a benchmark level of 80% of eyes within 0.5 D have still not been achieved.17 Logistic regression analysis for factors associated with post-phacoemulsification MRSE within 0.5 D showed there were no statistically significant correlations noted. This suggests that by looking at preoperative clinical characteristics, predicting which patients will achieve refractive outcomes within 0.5 D postoperatively may be highly unpredictable. This has to be addressed by proper preoperative counseling and management of expectations. This is relevant as there is an increasing trend of earlier phacoemulsification for post corneal refractive surgery eyes despite good vision or even 20/20 corrected distance visual acuity (CDVA).18 This may be because of intolerance of even mild visual disturbances from a faint cataract, desire for spectacle independence, or difficulty with lenticular myopic shift. This subset of patients and post-corneal refractive surgery patients, in general, tend to be very discriminating as they are used to a high level of vision. There are also theories on how corneal refractive surgery itself may induce cataract formation due to a combination of acoustic and photo-oxidative stress, which further emphasizes the need to have a reliable method for IOL power calculation in these eyes.19, 20
IOL power calculation in eyes after corneal refractive surgery is challenging but is of increasing importance within recent years. A steady increase in the number of these cases is well-documented in large-scale international studies.18 Moreover, the study population is largely Filipino, unlike other similar studies focusing on Caucasian eyes. There is evidence of smaller anterior segment measurements in Asian compared to Caucasian eyes, and these differences may have effects in IOL calculation.21 IOL constants from established sources, such as the User Group for Laser Interference Biometry, are generally optimized for eyes of a Caucasian population and are not extensively tested for other regional populations.4 As these calculation methods are used worldwide, adjustments based on results from different local surgeons can help fine tune current data towards more accurate results.
Limitations of the study
Patients enrolled in the study did not have comprehensive data regarding dry eye status aside from slit lamp biomicroscopy of the cornea. This is important since elevated tear film osmolality and significant dry eye can lead to inaccuracies with biometry measurements during preoperative cataract surgery planning. Measurements done in dry eye patients are known to have statistically significant higher variability in average keratometry readings and corneal astigmatism, resulting in calculated IOL power differences of more than 0.5 D among the same eyes within short-term repeated readings.22 However, dry eye screening prior to refractive surgery and phacoemulsification is done in the ambulatory surgical center.
Manifest refraction was taken within a range of time post-operatively between 3 weeks to 3 months, which depends on when the patient followed-up. This variability of the timing for refraction could affect results because of capsular bag changes during that range of time, although minimal as studies report.4 Data from a number of surgeons were included to
increase the sample size, and this may affect outcomes such as variation in personalized A-constants and surgically induced astigmatism. To calculate for the mean refractive PE, the method described by previous authors was that 1 D of IOL prediction error produces 0.7 D of refractive error at the spectacle plane. However, it is acknowledged that with very long or short eyes, this ratio increases. There were two biometers used, the IOL Master 700 and the Lenstar LS900. This may introduce some variability with biometry measurements, so to address this issue the IOL constants used for power computation were chosen according to which machine was used. Finally, topography measurements from the EyeSys Corneal Analysis System (EyeSys Vision Inc., TX, USA), Zeiss Atlas Humphrey topography (Carl Zeiss Meditec AG, Jena, Germany) and RTVue (Optovue Inc., CA, USA) were not available at the eye centers, so IOL power calculations were done without this data. This prevented the use of other formulas available in the ASCRS IOL calculator such as the Adjusted EffRP, Adjusted Atlas, Wang-Koch-Maloney and OCT. These data were excluded from calculation of the ASCRS average.
CONCLUSION
Accounting for PEs and variance, the ASCRSaverage with ΔMR is most recommended, followed by the ASCRS average No History if without historical data. The Haigis-L has the highest PEs and may lead to the least accurate results.
ACKNOWLEDGEMENTS
The authors would like to thank Dr. Nilo Florcruz and Dr. Richard Kho for their valuable contributions towards the conceptualization, refinement, and their advisory role towards this research manuscript.
REFERENCES
1. Seitz B, Langenbucher A, Nguyen NX, et al. Underestimation of intraocular lens power for cataract surgery after myopic photorefractive keratectomy. Ophthalmology.
1999;106(4):693-702.
2. Koch DD, Wang LJ, Surgery R. Calculating IOL power in eyes that have had refractive surgery. J Cataract Refract Surg. 2003;29(11):2039-2042.
3. Gale R, Saldana M, Johnston R, et al. Benchmark standards for refractive outcomes after NHS cataract surgery. Eye. 2009;23(1):149-152.
4. Wong CW, Yuen L, Tseng P, et al. Outcomes of the HaigisL formula for calculating intraocular lens power in Asian eyes after refractive surgery. J Cataract Refract Surg.
2015;41(3):607-612.
5. Naeser KJ. Incision size and corneal shape changes in sutureless cataract surgery. Ophthalmology 1995;102(11):1579.
6. Lyle WA, Jin GJ, Surgery R. Prospective evaluation of early visual and refractive effects with small clear corneal incision for cataract surgery. J Cataract Refract Surg. 1996;22(10):1456-
1460.
7. Masket S, Tennen DGJ, Surgery R. Astigmatic stabilization of 3.0 mm temporal clear corneal cataract incisions. J Cataract Refract Surg. 1996;22(10):1451-1455.
8. Meng W, Butterworth J, Malecaze F, Calvas PJ. Axial length of myopia: a review of current research. Ophthalmologica. 2011;225(3):127-134.
9. Haigis W. User Group for Laser Interference Biometry website. http://ocusoft.de/ulib/index.htm. Accessed October 13, 2018.
10. Feiz V, Mannis MJ, Garcia-Ferrer F, et al. Intraocular lens power calculation after laser in situ keratomileusis for myopia and hyperopia: a standardized approach. Cornea.
2001;20(8):792-797.
11. Wang L, Hill WE, Koch DD, Surgery R. Evaluation of intraocular lens power prediction methods using the American Society of Cataract and Refractive Surgeons postkeratorefractive intraocular lens power calculator. J Cataract Refract Surg. 2010;36(9):1466-1473.
12. Shammas HJ, Shammas MC, Garabet A, et al. Correcting the corneal power measurements for intraocular lens power calculations after myopic laser in situ keratomileusis. Am J
Ophthalmol. 2003;136(3):426-432.
13. Haigis W, Lege B, Miller N, et al. Comparison of immersion ultrasound biometry and partial coherence interferometry for intraocular lens calculation according to Haigis. Graefes Arch
Clin Exp Ophthalmol. 2000;238(9):765-773.
14. Barrett GD, Surgery R. Intraocular lens calculation formulas for new intraocular lens implants. J Cataract Refract Surg. 1987;13(4):389-396.
15. Barrett GD, Surgery R. An improved universal theoretical formula for intraocular lens power prediction. J Cataract Refract Surg. 1993;19(6):713-720.
16. Abulafia A, Hill WE, Koch DD, et al. Accuracy of the Barrett True-K formula for intraocular lens power prediction after laser in situ keratomileusis or photorefractive keratectomy for myopia. J Cataract Refract Surg. 2016;42(3):363-369.
17. Hahn U, Krummenauer F, Kölbl B, et al. Determination of valid benchmarks for outcome indicators in cataract surgery: a multicenter, prospective cohort trial. Ophthalmology. 2011;118(11):2105-2112.
18. Manning S, Barry P, Henry Y, et al. Cataract surgery outcomes in corneal refractive surgery eyes: Study from the European Registry of Quality Outcomes for Cataract and Refractive
Surgery. J Cataract Refract Surg. 2015;41(11):2358-2365.
19. Costagliola C, Di Giovanni A, Rinaldi M, et al. Photorefractive keratectomy and cataract. Surv Ophthalmol. 1997;42:S133-S140.
20. Wachtlin J, Blasig I, Schründer S, et al. PRK and LASIK— their potential risk of cataractogenesis: lipid peroxidation changes in the aqueous humor and crystalline lens of rabbits.
Cornea. 2000;19(1):75-79.
21. Qin B, Tang M, Li Y, et al. Anterior segment dimensions in Asian and Caucasian eyes measured by optical coherence tomography. Ophthalmic Surg Lasers Imaging Retina 2012;43(2):135-142.
22. Epitropoulos AT, Matossian C, Berdy GJ, et al. Effect of ear osmolarity on repeatability of keratometry for cataract surgery planning. J Cataract Refract Surg. 2015;41(8):1672-
1677.