Clinical Outcomes After Intravitreal Bevacizumab Injection for Diabetic Macular Edema
Karen Joyce G. Castro, MD, Marie Joan V. Loy, MD
Diabetic macular edema (DME) remains one of the major causes of visual impairment in patients with diabetic retinopathy. 1 An increasing prevalence of diabetic retinopathy has been demonstrated in Asian countries and worldwide. 2,3,4 Several inflammatory mediators, including vascular endothelial growth factor (VEGF), have been shown to be significantly involved in the development of DME. 5 The up- regulation of VEGF promotes angiogenesis and microvascular leakage, aggravating the disruption of the blood retinal barrier in DME. 5,6
Bevacizumab is a full length humanized mono – clonal anti-VEGF antibody. Its off-label evidence- based intravitreal applications include age-related macular degeneration, proliferative diabetic retino – pathy, neovascular glaucoma, retinopathy of pre – maturity, and macular edema secondary to retinal vein occlusion and diabetic retinopathy. 7,8 An increasing number of published randomized-controlled trials support the safety and efficacy of injecting intravitreal bevacizumab (IVB) in the treatment of DME, including the Pan-American Collaborative Retina Study, the Bevacizumab or Laser Therapy study and the study of Soheilian et al. 9-12 In a local retrospective study of Reyes, Aguilar, and Papa (unpublished data), IVB was found to be safe and effective in Filipino eyes with various retinal pathologies, such as age-related macular degeneration, macular edema secondary to retinal vein occlusion, and diabetic macular edema. However, no published study at present has specifically analyzed the clinical outcomes of IVB injections on DME in Filipino eyes
This study described the effects of IVB injection for DME on the best-corrected visual acuity (BCVA) and central foveal thickness (CFT) of Filipino patients in a tertiary hospital. Correlations were determined between (1) CFT and BCVA, (2) CFT and optical coherence tomography (OCT) patterns of DME, (3) number of injections with BCVA and CFT, (4) number of injections with OCT pattern of DME and presence of epiretinal membrane (ERM), (5) control and type of diabetes mellitus (DM) with BCVA and CFT. Ocular and systemic side effects of IVB injections were also reported.
METHODOLOGY
This was a retrospective non-comparative case series. Charts and macular OCT studies of patients who underwent intravitreal injection of 1.25 mg/0.05 Francisco, CA, USA) for DME from January 2012 to June 2013 at St. Luke’s Medical Center, Quezon City, were reviewed. Data gathered included: (1) patient’s age and sex, (2) BCVA, (3) CFT, (4) characteristic OCT pattern of DME, (5) the presence or absence of ERM on OCT, (6) total number of IVB injections received in 12 months, (7) type and control of DM, (8) ocular and systemic side effects of IVB. All data gathering and analyses were made at the first, third, sixth, and 12th month post-IVB injection.
BCVA was recorded by the attending ophthal – mologists using Snellen and Early Treatment Diabetic Retinopathy Study (ETDRS) charts and converted to logMAR units. CFT was previously measured using Cirrus OCT (Carl Zeiss Meditec, Inc., Dublin, CA, USA).
A separate independent observer (MJVL) identi – fied the OCT patterns of DME and the presence of ERM. The patterns of DME were identified based on their appearance on macular OCT imaging as described by Kim et al. 13 OCT patterns described in this study included: diffuse retinal thickening, cystoid macular edema (CME), presence of subretinal fluid (SRF), and CME with SRF. Diffuse retinal thickening was characterized by increased CFT (greater than 310 microns) with reduced intraretinal reflectivity and expanded areas of lower reflectivity. CME had intraretinal round or oval areas of low reflectivity with highly reflective septa separating the hyporeflective cavities. SRF was described as an accumulation of hyporeflective fluid beneath a highly reflective dome- shaped elevation of detached neurosensory retina. 14 A moderately reflective band adherent to the retina identified the presence of ERM. The reader was blinded on the BCVA, number of injections, and control and type of DM, but was aware that the patients were given IVB injections for DME.
To avoid for any maximum or minimum effect, the percent change in CFT was included as a “treat – ment response”. It was calculated as the change in CFT divided by the baseline CFT multiplied by 100. A nega – tive value meant that the retina has reduced thickness.
Statistical analysis
Descriptive statistics were used for quantitative variables and percentages for qualitative variables. Correlations between two quantitative variables were determined using Pearson’s correlation coefficient. Comparison of dichotomous quantitative variables was analyzed using independent t-test and ANOVA. Chi-square test was used for two qualitative variables. Comparison of quantitative variables before and after treatment was done using the paired t-test. Level of significance was set at p≤0.05.
RESULTS
Sixty-eight eyes received IVB injection from January 2012 to June 2013 at St. Luke’s Medical Center, Quezon City. Twenty-seven eyes were excluded due to incomplete data and the remaining 41 eyes were analyzed. There were 34 females (82.9%) and 7 males (17.1%). The mean age was 58 years (range 48 to 68 years).
There was a consistent improvement in the mean BCVA from baseline (0.62) up to the 12th month (0.26) post-injection (Table 1). There was a steady increase in the mean change in BCVA from the 1st month (0.13) to the 12th month (0.42). All comparisons were statistically significant at all time periods.
Table 1. Mean BCVA and mean change in BCVA after IVB injection.
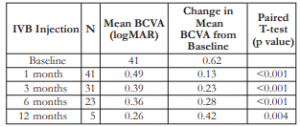

BCVA – best-corrected visual acuity, IVB – intravitreal bevacizumab
A continual decrease in mean CFT was noted from baseline (512 microns) until the 12th month (323 microns) post-injection (Table 2). A consistent decrease in the change in mean CFT (increasing negative value) was appreciated at the 1st month (16%) up to 12th month (41%). All comparisons were also statistically significant at all time periods until the 6th month (p<0.001).
Table 2. Mean BCVA and mean change in BCVA after IVB injection.
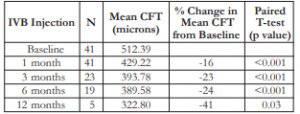

CFT – central foveal thickness, IVB – intravitreal bevacizumab
The changes in mean BCVA and mean CFT in the first, third, and 12th month post-injection appeared to have an inverse relationship (negative Pearson’s correlation) (Table 3); however, the values in between groups were not statistically different.
Table 3. Correlation between change in BCVA and percent change in CFT after IVB injection.
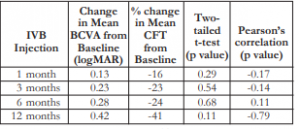

BCVA – best-corrected visual acuity, CFT – central foveal thickness, IVB – intravitreal bevacizumab
The mean number of injections was 4 (minimum of 2 and maximum of 9). Patients who received 4 or more injections also had worse mean BCVA across all time periods. However, the comparisons were not statistically significant except at the 6th month post- injection (Table 4).
Table 4. Correlation between the number of IVB injections and the mean BCVA.
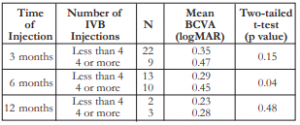

BCVA – best-corrected visual acuity, IVB – intravitreal bevacizumab.
Patients who received 4 or more injections also had greater CFTs (thicker macula) and greater changes in CFT across all time periods. The comparisons were not statistically different except at the 6th month (Table 5).
Table 5. Correlation between the number of IVB injections and the mean CFT.
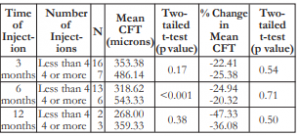

CFT – central foveal thickness, IVB – intravitreal bevacizumab
Majority (51.22%) had the diffuse type of DME on OCT (Table 6). SRF and CME with SRF were the least common types. Most (65%) had no ERM on OCT. There was no correlation between the number of injections and the type of OCT pattern of DME (p=0.42), nor the presence or absence of ERM (p=0.35).
Table 6. Correlation between number of IVB injections with (A) OCT pattern of DME and (B) presence or absence of ERM.
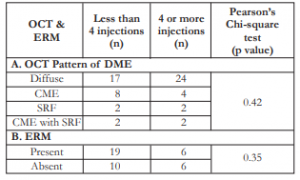

IVB – intravitreal bevacizumab, OCT – optical coherence tomography, DME – diabetic macular edema, ERM – epiretinal membrane
The change in mean CFT for every OCT pattern of DME was variable through all time periods. Although all changes showed decrease in mean CFT (negative values) from baseline, there was no significant difference among the OCT pattern of DME with change in CFT for every time period. No correlation existed between different OCT patterns and their response to treatment (Table 7).
Table 7. Correlation of OCT pattern of DME with percent change of CFT.
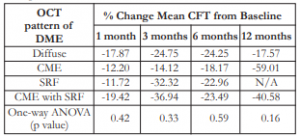

OCT – optical coherence tomography, DME – diabetic macular edema, CFT – central foveal thickness, SRF – sub-retinal fluid, ANOVA – analysis of variance
Twenty-five patients (61%) had uncontrolled DM, 7 (17.1%) had good control, and 9 (22%) unknown status. The mean BCVA appeared to improve among patients with controlled DM compared to the uncontrolled group. However, this difference was only significant at the first month post- injection (Table 8). The mean CFT seemed greater among patients with uncontrolled DM versus those with good control. However, this difference was not statistically significant.
Table 8. Correlation between DM control with mean BCVA and mean CFT after IVB injection.

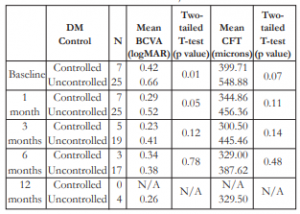
DM – diabetes mellitus, BCVA – best-corrected visual acuity, CFT – central foveal thickness
Thirty-nine (95.1%) patients had type 2 DM and 2 patients (4.9%) type I. The mean BCVA had a variable trend among type 1 and type 2 DM across all time periods, and these differences were not statistically significant (Table 9). Mean CFT appeared to be greater among type 1 versus type 2 patients, but the differences were not statistically significant, except on the 3rd month post-injection.
Table 9. Correlation between the type of DM and mean BCVA and mean CFT.
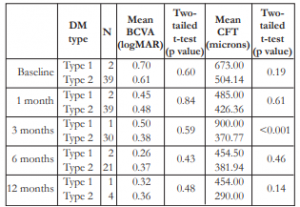

DM – diabetes mellitus, BCVA – best-corrected visual acuity, CFT – central foveal thickness
There was no report of severe ocular adverse effects of IVB injection, such as retinal detachment, vitreous hemorrhage, cataract, uveitis, or endophthalmitis. Three patients (7%) had increased intraocular pressure post-IVB injection that were controlled medically. No systemic side effects, such as stroke or myocardial infarction, were described.
DISCUSSION
These results showed a consistent improvement in mean BCVA (decreasing logMAR values) and a steady decrease in mean CFT after IVB injection. A continued positive change in mean BCVA (approach – ing 20/20) and a negative change in mean CFT (decreasing retinal thickness) were observed from baseline up to the 12th month post-injection. These results were consistent with the Diabetic Retinopathy Clinical Research Network definition of “clinical improvement”: (1) an increase of at least 0.2 logMAR or 10 ETDRS letters, and (2) at least a 20% reduction in CFT. 14 This study showed that there was an increase of 0.23 logMAR in BCVA and a 23% reduction in CFT on the third month. Continued improvement was also noted up to the sixth month post-IVB injection. All comparisons were statistically significant until the sixth month.
After IVB injection, improvements in BCVA were accompanied with a reduction in CFT (negative Pearson’s correlation). This supported the report of Kim that demonstrated a correlation between BCVA and CFT with each 100-micron increase in CFT corresponding to a worsening of BCVA by 0.16 logMAR units. 13 However, there was no correlation established between the percent change in CFT and the OCT pattern of DME.
Currently, there are no guidelines on the minimum or maximum number of IVB injections for DME that will provide significant improvement on BCVA and CFT. Moreover, this study showed no consistent correlation between the number of injections and improvements in BCVA and CFT (except at 6 months). Likewise, the number of injections did not seem to affect the response of patients to the drug based on the percent mean change in CFT. There was no correlation established between the number of IVB injections and the OCT pattern of DME and presence of ERM.
Intensive control of DM is known to reduce the progression of diabetic retinopathy. 15,16 This study did not show a consistent correlation of DM control or type with BCVA and CFT.
As this was a retrospective study with a small sample size, several limitations were inherent. The number and frequency of injections were not standardized. The population comprised of private and non-private patients, whose number and frequency of IVB injections were variable and reported by their individual attending ophthalmologists. The sample size decreased over time, with only 5 patients completing the 12-month follow up. Dropouts were probably due to poor follow ups and/or financial constraints. Moreover, only the short-term efficacy of bevacizumab was analyzed in this study with only 12 months of observation. The measurement of BCVA was also not uniform. The conversions of Snellen and ETDRS BCVA to logMAR were not highly accurate and could over or underestimate BCVA. 17-19 Measurement of DM control was not comprehensive, as the duration of DM was not analyzed.
This study, however, did show an improvement in BCVA and a decrease in CFT after IVB injection for DME among Filipino eyes. No systemic or severe ocular adverse effects were observed. A larger sample size and longer follow up are highly recommended.
REFERENCES
1. Chen E, Looman M, Laouri M, et al. Burden of illness of diabetic macular edema: literature review. Curr Med Res Opin 2010;26:1587-1597.
2. Yang W, Lu J, Weng J, et al. Prevalence of diabetes among men and women in China. N Engl J Med 2010;362:1090- 1101.
3. Yau JW, Rogers SL, Kawasaki R, et al. Global prevalence and major risk factors of diabetic retinopathy. Diabetes Care 2012;35:556-564.
4. Ding J, Wong TY. Current epidemiology of diabetic retinopathy and diabetic macular edema. Curr Diab Rep 2012;12:346-354.
5. Scholl S, Kirchhof J, Augustin AJ. Pathophysiology of macular edema. Ophthalmologica 2010;224 (Suppl 1):8-15.
6. Iacono P, Battaglia Parodi M, Bandello F. Antivascular endothelial growth factor in diabetic retinopathy. Dev Ophthalmol 2010;46:39-53.
7. Kaiser PK. Antivascular endothelial growth factor agents and their development: therapeutic implications in ocular diseases. Am J Ophthalmol 2006;142:660-668.
8. Lynch SS, Cheng CM. Bevacizumab for neovascular ocular diseases. Ann Pharmacother 2007;41:614-625.
9. Soheilian M, Ramezani A, Obudi A, et al. Randomized trial of intravitreal bevacizumab alone or combined with triamcinolone versus macular photocoagulation in diabetic macular edema. Ophthalmology 2009;116:1142-50.
10. Fung AE, Rosenfeld PJ, Reichel E. The International Intravitreal Bevacizumab Safety Survey: using the internet to assess drug safety worldwide. Br J Ophthalmol 2006;90:1344- 1349.
11. Arevalo, JF, Sanchez JG, Wu L, et al. Primary intravitreal bevacizumab for diffuse diabetic macular edema: the Pan American Collaborative Retina Study Group at 24 months. Ophthalmology 2009;116:1488-97.
12. Rajendram R, Fraser-Bell S, Kaines A, et al. A 2-year prospective randomized controlled trial of intravitreal bevacizumab or laser therapy (BOLT) in the management of diabetic macular edema: 24-month data: report 3. Arch Ophthalmol 2012;130:972-979.
13. Kim BY, Smith SD, Kaiser PK. Optical coherence tomographic patterns of diabetic macular edema. Am J Ophthalmol 2006;142:405-412.
14. Bressler SB, Qin H, Beck RW, et al. Factors associated with changes in visual acuity and central subfield thickness at 1 year after treatment for diabetic macular edema with ranibizumab. Arch Ophthalmol 2012;130:1153-1161.
15. Gray A, Raikou M, McGuire A, et al. United Kingdom Prospective Diabetes Study Group. Cost effectiveness of an intensive blood glucose control policy in patients with type 2 diabetes: economic analysis alongside randomised controlled trial (UKPDS 41). BMJ 2000;320:1373-8.
16. Early worsening of diabetic retinopathy in the Diabetes Control and Complications Trial. Arch Ophthalmol 1998;116:874-86.
17. Falkenstein I, Cochran D, Azen S, et al. Comparison of visual acuity in macular degeneration patients measured with Snellen and Early Treatment Diabetic Retinopathy Study charts. Ophthalmology 2008;115:319-323.
18. Kaiser P. Prospective evaluation of visual acuity assessment: a comparison of Snellen versus ETDRS charts in clinical practice. Trans Am Ophthalmol Soc 2009;107:311-324.
19. Williams M, Moutray T, Jackson A. Uniformity of visual acuity measures in published studies. Invest Ophthalmol Vis Sci 2008;49:4321-4327.