Structure-Function Correlations of Glaucoma in Filipinos
Kimberly Ann T. Cotaoco MD, Patricia M. Khu MD, John Mark S. de Leon MD
Ralph Anthony H. de Jesus MD
Department of Ophthalmology, Cardinal Santos Medical Center, San Juan City, Metro Manila
Corresponding Author: John Mark S. de Leon MD
Clinic Address: Rm 471 MAB3, Cardinal Santos Medical Center, Wilson Street, Greenhills, San Juan City, Metro Manila, Philippines
Contact Number: +632 87270001 local 2471
Email Address: jmarkmd1@yahoo.com
Disclosure: All the authors have no proprietary interest in any of the devices mentioned in this study. This study did not receive financial support from any external source.
Glaucoma is a chronic disease of the optic nerve characterized by the loss of retinal ganglion cells and specific patterns of progressive VF loss.1 The VF defects in glaucoma are found to follow specific distributions based on the anatomic pattern of RNFL thinning. These localized VF defects as seen on SAP were defined in several landmark glaucoma studies, such as the Ocular Hypertension Treatment Study (OHTS) and the Advanced Glaucoma Intervention Study (AGIS).2,3 Sihota et al. proposed simpler definitions for classifying VF defects.4 In clinical practice, many VF defect patterns are non-specific, especially if non-reproducible; hence, correlation with structural findings are necessary to confirm if the defects are glaucomatous or not.
Structure-function correlation has been improved by attempts of several investigators to create correspondence maps between the peri-papillary RNFL (pRNFL) thickness distribution and equivalent areas measured in SAP. Garway- Heath et al. developed a clinically useful map that relates VF test points to regions of the optic nerve head (ONH).5 Ferreras et al., using time-domain optical coherence tomography (TD-OCT), determined that there was moderate correlation between chosen VF clusters and RNFL thickness in glaucoma patients.6 In a more recent study, Kanamori et al., using three SD-OCT devices, showed similar overall correlation with VFs.7
In using correspondence maps, studies have shown varying degrees of structure-function correlation in glaucoma. There is still limited data on the characteristics of structure-function correlations in glaucoma among Filipino patients. A hospital-based Filipino study assessed the relationship of SAP, OCT, and disc photos in the diagnosis of glaucoma but concentrated more on diagnostic accuracy rather than pattern observations of correlation.8
This study determined the structure-function correlations in different glaucoma severities using SD-OCT and SAP VF parameters among Filipino eyes.
METHODS
Retrospective data from January 2013 to August 2015 of corresponding SAP VF (Humphrey Field Analyzer; Carl Zeiss Meditec, Dublin, CA, USA), SD-OCT RNFL/ONH (Cirrus OCT, Carl Zeiss Meditec, Dublin, CA, USA), and disc photographs performed at the eye center of the Cardinal Santos Medical Center were reviewed. Patients were initially selected from their glaucoma tests at the eye center based on either an abnormal VF or OCT results or both and confirmed by two glaucoma specialists. The medical records of these chosen patients, if available, were obtained from the private/service clinics of the physician within the hospital. Patients with co-existing ocular problems that could affect VF and OCT test results, such as dense cataracts, age-related macular degeneration, retinopathies, macular holes, among others were excluded. The study was approved by the Cardinal Santos Medical Center Research Ethics Review Committee prior to data collection and adhered to the tenets of the Declaration of Helsinki.
Demographic characteristics and clinical information of included eyes were obtained from the medical records. The following were collected: age (in years), sex, best corrected visual acuity (BCVA), intraocular pressure (IOP), and the presence of other associated eye conditions.
Only reliable 30-2 or 24-2 Swedish Interactive Thresholding Algorithm (SITA) standard or full threshold SAP VF results, defined as fixation losses less than 20%, false positive and false negative errors less than 33%, were included. For each eye, only 1 visual field test was selected for the study. For tests done on different occasions for the same patient, the one with the best reliability indices was chosen. For those with good reliability indices, the latest test was selected to minimize the effects of the learning curve. Poor quality OCT images, defined as signal strength less than 6, were excluded. Each set of tests was classified by a glaucoma specialist according to the type of glaucomatous defects based on the OHTS definitions and the classification by Sihota et al., and the severity graded based on the Hodapp-Parrish-Anderson criteria.4,9
The correlations between SAP global indices (MD and PSD), average pRNFL thickness and RA, and peripapillary RNFL thickness in each quadrant (superior, inferior, nasal, temporal) of the SD-OCT were determined by regression analysis. The SAP threshold values in decibels (dB) of the 52 test points of the Humphrey VF were converted to a linear scale (Lambert) and subdivided into 5 clusters each for the superior and inferior hemifields and the values in each VF cluster were averaged and correlated with the RNFL thickness at each of the 12 clock-hour segments of the SD-OCT based on the study of Ferreras et al.6 A P value < 0.05 indicates statistical significance of the correlation.
RESULTS
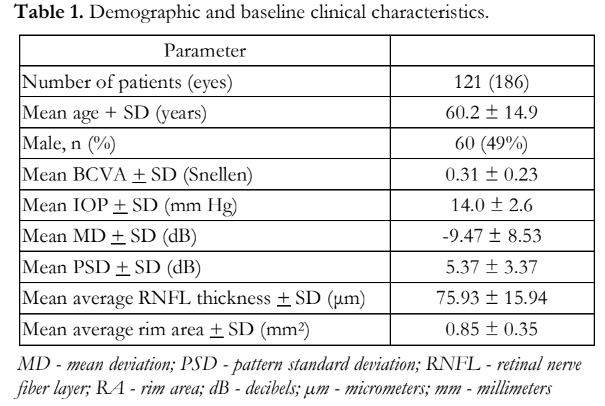
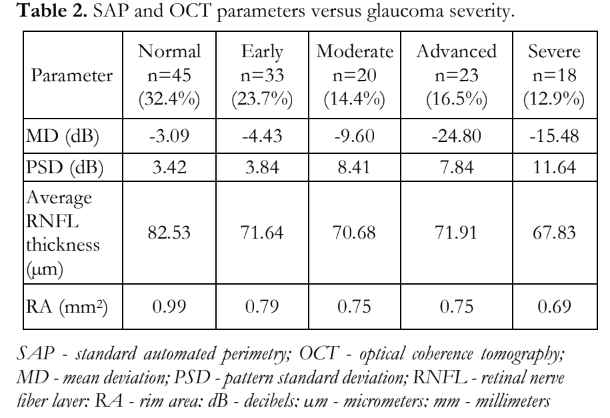
The study enrolled 186 eyes of 121 patients with mean age of 60.2 + 14.7 years and baseline SAP VF and SD-OCT parameters as shown in Table 1. SAP VF and SD-OCT parameters were measured according to glaucoma severity (Table 2). The most common types of VF defects were central island (16.5%), combined (14.4%), and paracentral (12.2%) for the severe, moderate, and early categories, respectively.
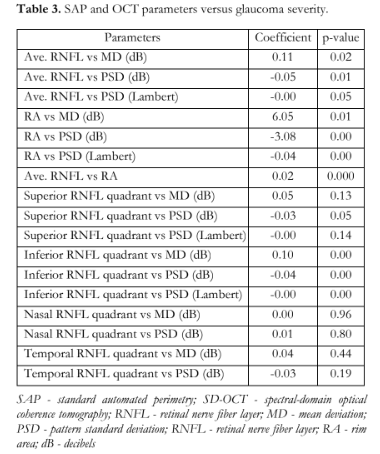
The correlation among the different parameters of SAP and SD-OCT are presented in Table 3. The correlation between the average pRNFL thickness and MD, and between the average pRNFL thickness and PSD were significant. For every μm decrease in the average pRNFL thickness, there was a corresponding 0.11 dB decrease in MD. For every μm decrease in the average pRNFL thickness, there was a corresponding 0.05 dB/Lambert increase in PSD. These correlations, however, did not hold when cases were sub-grouped by glaucoma severity.
The correlation between RA and MD, and between RA and PSD were significant. For every mm2 decrease in RA, there was a corresponding 6.05 dB decrease in MD. For every mm2 decrease in RA, there was a corresponding 3.08 dB/Lambert increase in PSD. These correlations, however, did not hold when cases were sub-grouped by glaucoma severity.
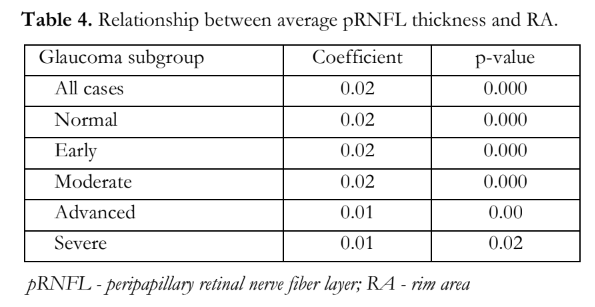
For every μm decrease in the average pRNFL thickness, there was a corresponding 0.02 mm2 decrease in RA. This significant correlation was consistently observed when cases were sub-grouped by glaucoma severity [range: 0.009 to 0.019] (Table 4).
For the superior pRNFL thickness, there was no significant correlation with MD and there was borderline correlation with PSD. For every μm decrease in the superior pRNFL thickness, there was a corresponding 0.03 increase in PSD in decibels (p=0.051) but not in Lambert (p=0.141). For the inferior pRNFL thickness, there was a significant correlation to both MD and PSD. For every μm decrease in the inferior pRNFL thickness, there was a corresponding 0.1 dB decrease in MD (p=0.000). For every μm decrease in the inferior pRNFL thickness, there was a corresponding 0.04 increase in PSD in dB (p=0.000) and Lambert (p=0.005). These correlations, however, did not hold when cases were sub-grouped by glaucoma severity.
There were no significant correlations between MD and PSD values to nasal and temporal pRNFL thicknesses.
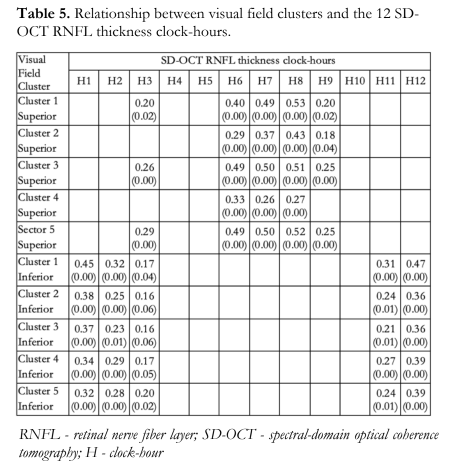
Correlation of the 5 clusters in each superior and inferior VF hemifields to the 12 clock-hour RNFL segments showed the strongest correlation between the superior VF clusters and the 6 to 8- o’clock SD-OCT RNFL segments. This was followed by a less strong correlation between the inferior VF clusters and the 12- to 1-o’clock RNFL segments (Table 5).
DISCUSSION
Structure-function correlation is the preferred practice pattern in glaucoma diagnosis and management. Knowledge of specific correlations between structure and function could aid in diagnosing and managing glaucoma better. Due to normal variations in the structure of the ONH and the several factors that can affect the accuracy and reliability of VFs, there is a need to ascertain the degree of correlation between these 2 aspects of determining glaucomatous optic neuropathy. Moreover, there are other optic nerve diseases that have distinctive VF defects that can confound assessment of the ONH.
There are several studies that reported varying degrees of correlation between structure and function in glaucoma, with some reporting that structural changes preceded functional changes especially in early glaucoma.10-12 Several investigators have established maps relating VF regions to specific optic disc segments to quantitatively determine and improve the assessment of this relationship.5,6,12,13 Correspondence maps have been generated from objective and highly reproducible techniques to better quantify specific structure-function relationships in different regions of the central visual field, and possibly explain these variations.
In this study, we utilized the 5 clusters in the superior and 5 clusters in the inferior hemifields of the VF established by Ferreras et al.6 and correlated them to the 12 clock-hour segments of the optic disc measured by SD-OCT. Similar to their results, we showed the strongest correlations were between the superior VF clusters and the 6-8 o’clock OCT pRNFL segments. These 3 clock-hour segments, particularly the 7 and 8 o’ clock-hour segments, correlated best with the upper VF clusters 1, 3, and 5. Anatomically, the papillomacular bundle representing the retinal ganglion cell axons emanates from the superior and inferior poles of the ONH. These areas are more commonly affected in early stages of glaucoma because of their thicker segments, making detection of changes numerically larger and easier.5,6,7 Evidences for this are the more frequent occurrences of disc hemorrhages and enlargement of the vertical cupping (notching) in these areas. It is a generally known observation that, structurally, the inferotemporal rim of the ONH is the initial site of glaucoma damage and would thus correlate with changes in the superior visual field.14 This specific area of the ONH, also called by Hood et al. as the macular vulnerability zone or the temporal portion of the inferior quadrant of the optic disc, is where glaucoma damage predominantly occurs.15 The addition of analyzing the ganglion cell complex in the macular region using OCT may, therefore, provide earlier detection of early changes in the papillomacular bundle. On the other hand, identification of SD-OCT changes in the horizontal segments may be more difficult since RNFL bundles here are anatomically thinner.6
For the inferior hemifield, a less strong correlation between the inferior VF clusters and the superior OCT RNFL segments were observed at 11, 12, and 1 o’clock corresponding to the vertical poles of the ONH. These 3 clock-hours correlated best with the inferior VF 1 to 5 clusters.
This study and others showed that there was no one-to-one correspondence between specific SD-OCT pRNFL segments and VF clusters as some OCT clock hour segments were more correlated with some VF clusters than others.5,6,10- 12 OCT is only a representation or surrogate of actual histology or anatomy, so there may be considerable overlap between the OCT clock hour segments and VF clusters in terms of structure- function correlation. Furthermore, VF is a subjective test and may be prone to test-retest variability issues. Variables that could have also influenced the results were the different stages or severities of glaucoma. In all cases combined (Table 3), there were correlations observed between average RNFL thickness and VF global indices but these observations were not evident in sub-group analyses considering the glaucoma severity. Either the sample size in each category was not adequate or the different types of VF defects were not adequately represented in this study, and both factors could have influenced the inability to correlate structure and function within each subgroup. The severity of glaucoma was classified based on VF findings and not on OCT. It is known that different areas in the VF have redundant innervation and that significant RNFL thinning is needed to detect an early VF defect. This relationship is not linear and, therefore, more difficult to correlate when both modalities (SAP and OCT) are measuring different parameters using different scales.
The nasal and temporal aspects of the ONH, located on the horizontal poles and represented by the 4 and 9 o’ clock-hour RNFL segments, were less well to poorly correlated in terms of structure and function (Table 3) mainly because these areas are not part of the central bulk of the papillomacular bundle affected in glaucoma.
As expected, there was strong correlation between the average RNFL thickness and rim area measurements even within the subgroup analyses taking into account glaucoma severity, indicating that rim area can also be used to distinguish between normal and different levels of glaucoma damage. Some previous studies on the structure- function relationship maintained that the units of measurement in both must be the same (either linear or logarithmic); hence, the utilization of the Lambert or linear scale for VF sensitivity aside from the conventional dB (logarithmic).16 In this study, we converted the decibel values to Lambert when analyzing the correlation between the VF clusters and the OCT RNFL segments; however, there was no significant difference even if there was a conversion comparing it to traditional dB. The VF sensitivities, whether in dB or Lambert, still had significant correlation with all OCT structural parameters except for the superior RNFL quadrant thickness and the PSD (Lambert).
In conclusion, this real-world structure-function study, the first among Filipino glaucoma patients, demonstrated that there was a stronger structure-function correlation between specific segments of the superior VF and specific RNFL segments of the inferior ONH compared to the inferior VF and specific RNFL segments of the superior ONH. Both represent the vertical poles of the ONH where early glaucoma changes are more likely to occur compared to the nasal and temporal quadrants of the ONH. The correlation of structure and function in glaucoma is not precise and there is an overlap in the representation of the VF regions with the RNFL.
REFERENCES
- Niforushan N, Nassiri N, Moghimi S, et al. Structure- function relationships between spectral-domain OCT and standard achromatic perimetry. Invest Ophthalmol Vis Sci 2012; 53: 2740-2748.
- Keltner JL, Johnson CA, Cello KE, et al. Classification of visual field abnormalities in the Ocular Hypertension Treatment Study. Arch Ophthalmol 2003; 121: 643-650.
- Advanced Glaucoma Intervention Study. 2. Visual field test scoring and reliability. Ophthalmology 1994; 101: 1445-1455.
- Sihota R, Gupta V, Tuli D, et al. Classifying patterns of localized glaucomatous visual field defects on automated perimetry. J Glaucoma 2007; 16: 146-152.
- Garway-Heath DF, Poinoosawmy D, Fitzke F, et al. Mapping the visual field to the optic disc in normal tension glaucoma eyes. Am J Ophthalmol 2000 107: 1809-1815.
- Ferreras A, Pablo LE, Garway-Heath DF, et al. Mapping standard achromatic perimetry to the peripapillary retinal nerve fiber layer in glaucoma. Invest Ophthalmol Vis Sci 2008; 49: 3018-3025.
- Kanamori A, Nakamura M, Tomioka M, et al. Structure- function relationship among three types of spectral-domain OCT instruments in measuring peripapillary retinal nerve fiber layer thickness. Acta Ophthalmol 2013; 91: e196-e202.
- Rodriguez-Chan MJ, Khu PM, Lat-Luna M, et al. Correlation of structure and function in glaucoma. Philipp J Ophthalmol 2009; 34:15-18.
- Hodapp E, Parrish RK II, Anderson DR. Clinical decisions in glaucoma. St Louis: The CV Mosby Co, 1993; 52–61.
- Miglor S, Riva I, Guareschi M, et al. Retinal sensitivity and retinal nerve fiber layer thickness measured by optical coherence tomography in glaucoma. Am J Ophthalmol 2007; 144: 733-740.
- Wu H, de Boer JF, Chen L, et al. Correlation of localized glaucomatous visual field defects and spectral-domain optical coherence tomography retinal nerve fiber layer thinning using a modified structure-function map for OCT. Eye 2015;1-9.
- Asaoka R, Russell RA, Malik R, et al. A novel distribution of visual field test points to improve correlation between structure-function measurements. Invest Ophthalmol Vis Sci 2012; 53: 8396-8404.
- Ganeshrao SB, Turpin A, Denniss J, et al. Enhancing structure-function correlations in glaucoma with customized spatial mapping. Ophthalmology 2015.
- Jonas JB, Fernández MC, Stürmer J. Pattern of glaucomatous neuroretinal rim loss. Ophthalmology 1993;100:63-68.
- Hood DC. Improving our understanding and detection of glaucomatous damage: an approach based upon optical coherence tomography (OCT). Progress Retinal Eye Res 2017;57:46-75.
- Malik R, Swanson WH, Garway-Heath DF. Structure– function relationship in glaucoma: past thinking and current concepts. Clin Exp Ophthalmol 2012 40:369-380.