Peripapillary Microvascular Parameters in Unilateral Open-Angle Glaucoma Using the Optical Coherence Tomography-Angiography
Victor Ephraime V. Paulino, MD, DPBO
John Mark S. de Leon, MD, DPBO
Eye Institute, St. Luke’s Medical Center, Quezon City, Metro Manila, Philippines
Corresponding Author: Victor Ephraime V. Paulino, MD, DPBO
Clinic Address: Eye Institute, St. Luke’s Medical Center, #279 E. Rodriguez, Sr. Avenue, Quezon City, Philippines 1112
Contact Number: +632 8-7230101 ext 4100/5548
Email Address: rempaulino@gmail.com
Disclosure: The authors declare no conflict of interest. No funding was received for the conduct of this study.
Glaucoma is a group of diseases characterized by retinal ganglion cell (RGC) degeneration leading to a characteristic optic neuropathy. It is the third leading cause of blindness and the leading cause of irreversible blindness worldwide.1 The diagnosis of glaucoma is determined by qualitative and quantitative structural anatomical changes and functional loss. The precise pathophysiology of this disease, the gold-standard diagnostic method, and the effective treatment and cure have yet to be determined. Our current understanding points to loss in structural integrity preceding functional deficits. An elevated intraocular pressure (IOP) is considered the most significant and currently the only modifiable risk factor that can influence its development and progression.2,3 Together with IOP determination, ophthalmologists use stereoscopic clinical examination of the optic disc, visual field (VF) tests combined with optical coherence tomography (OCT) to examine the optic nerve head, peripapillary retinal nerve fiber layer (pRNFL), and macular inner retinal layers to diagnose glaucoma. These well-established diagnostic tests are utilized by eye doctors worldwide to obtain anatomical and functional information that aid in the management of glaucoma.4
Among the various proposed mechanisms of glaucoma pathophysiology, evidence supports the vascular theory leading to progressive RGC degeneration and death.5-10 This theory suggests an interplay of alteration in the quality of ocular blood flow and vasculature,9-12 fluctuation in vascular ocular perfusion pressure,10 and disturbance in vascular autoregulation.7,13-15 These events, combined with the presence of risk factors, such as elevated IOPs,2,3,6 difference in retinal vascular caliber,16 or presence of systemic hypertension,17-19 lead to secondary disruption in molecular homeostasis and eventual RGC apoptosis.6,9
Technological advancements in the last decade paved the way for the development of clinical tests for optic disc perfusion and microvascular analysis,20,21 Doppler OCT,22,23 and other hemodynamic imaging modalities.24,25 Utilizing the science behind conventional OCT, the novel OCT angiography (OCT-A) compares both amplitude and phase differences between consecutive B-scans, particularly by the movement of red blood cells or blood though intact vasculature.
While the sensitivity of peripapillary OCT-A parameters in diagnosing glaucoma was shown to be high,26-28 recent studies involving unilateral or asymmetric glaucoma showed conflicting results. A study by Yarmohammadi et al. demonstrated that vascular density (VD) was reduced in perimetrically intact hemi-retinas of the same eye of glaucoma patients29 and that OCT-A was able to detect microvascular changes before VF damage in the unaffected contralateral eye of the same patient.30 Another study demonstrated evidence that early reduction of VD was present following an acute primary angle closure attack, and that a lower VD at 2 months was the best predictor of conversion to an abnormal RNFL thickness.31 On the other hand, in a study involving unilateral pre-perimetric glaucoma, clinically unaffected eyes showed thinner structural parameters, but no significant microvasculature differences compared with non-glaucomatous eyes.32 Nevertheless, given that there are cases wherein microvascular attenuation occurs before structural changes, OCT-A can be useful in early detection of glaucoma, especially in high-risk eyes such as in normal contralateral eyes of unilateral primary open-angle glaucoma (POAG) or normal tension glaucoma (NTG).
This study looked into the ocular blood flow and vasculature component of the “vascular theory of glaucoma” by investigating and studying the utility of OCT-A in measuring VAD and BFI among eyes-at- risk compared to their contralateral glaucomatous eyes, and to age- and sex-matched healthy controls. VAD (also referred to as perfusion) is the percentage of vessels occupying the radial peripapillary capillary layer; while BFI provides a measure of flow in the corresponding vascular area.33 By looking into the microvascular parameters of the eyes, we may detect clues, details, or patterns that can serve as markers in early detection of structural changes, even prior to RGC degeneration, irreversible optic nerve damage, and VF loss.
There are limited studies on the microvascular network in normal and glaucomatous eyes of Filipinos. Hence, this study compared the pRNFL microangiographic properties of glaucomatous eyes to their contralateral eyes-at-risk among patients with unilateral POAG or NTG, and to healthy age- and sex-matched normal controls. Specifically, it measured the VAD and BFI among glaucomatous eyes compared to contralateral eyes-at-risk and healthy controls using OCT-A, investigating the utility of the OCT-A parameters in the early detection of glaucoma.
METHODS
This case-control study was conducted at St. Luke’s Medical Center (SLMC) Eye Institute (EI), Quezon City, Metro Manila, from June 2020 to June 2021. The subjects were adult Filipino patients, aged 18 years and above, who were clinically diagnosed with POAG or NTG in one eye and normal contralateral eye. Excluded were those with significant media opacity (e.g. corneal scar, posterior subcapcular opacities, vitreous hemorrhage) preventing good-image quality scans, other types of glaucoma, retina and optic nerve conditions with vascular abnormalities, and previous retina lasers. Control subjects with history of migraine, systemic vaso-occlusive disease, and/or use of vasoactive medications were also excluded. Each subject was compared to an age- and sex-matched normal control.
Those with unilateral POAG or NTG, based on clinical records from the glaucoma clinic, were invited to join the study on their clinic consultation schedule. Both eyes were tested in each participant and assigned either to the eyes-at-risk or glaucoma groups. An age- and sex-matched normal control group was recruited from the general ophthalmology clinic. Assignment of groupings was concealed from both the technician who performed the OCT-A and the data analyst.
Spectral-domain OCT with OCT-A capability (Cirrus HD-OCT Model 5000 with AngioPlex®, Carl Zeiss Meditec, USA) was utilized in this study. OCT-A parameters were taken from both eyes of all subjects with their pupils dilated, unless clinically contraindicated. After pupil dilation with 0.5% Tropicamide + 0.5% phenylephrine HCl (Sanmyd-P, Santen, Japan) eyedrops given at 1 drop to both eyes every 5 minutes for 3 doses, the subject’s head was stabilized by chin and forehead rests of the OCT machine. A single OCT-A scan was obtained and the examination was deemed acceptable if the signal strength was 7/10 or better, with good quality scan.
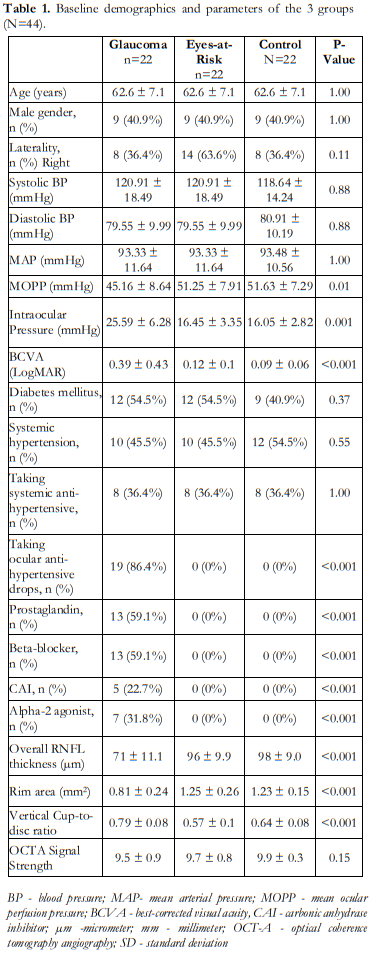
Primary outcome measures included mean overall and quadrantal VAD and BFI of the three groups. Secondary outcome measures were frequency of systemic hypertension, diabetes mellitus, intake of oral and topical anti-hypertensive medications, blood pressure (BP), best-corrected visual acuity (BCVA), IOP, overall pRNFL thickness, rim area value, vertical cup-to-disc ratio (CDR), mean arterial pressure (MAP), and mean ocular perfusion pressure (MOPP). MOPP was derived from the BP measurement and computed as 2/3 (MAP-IOP), where MAP is equal to diastolic BP + 1/3 (systolic BP – diastolic BP).
Sample size was calculated based on the test of hypothesis for the difference between two means of overall VAD. Assuming that mean and standard deviation of the overall VAD among glaucomatous patients is 0.40 ± 0.09, and for normal healthy adults 0.47 ± 0.04,34 with an alpha error of 5%, power of 95% and a one-tailed alternative hypothesis, sample size calculated was 22. Consequently, 22 normal, age- matched and sex-matched individuals were recruited to serve as control.
Descriptive statistics summarized the clinical characteristics of the participants. Frequency and proportion were used for nominal variables and mean and SD for interval/ratio variables. One-way analysis of variance (ANOVA) determined the level of significance between groups.
Outcome measures were analyzed with the one-way ANOVA using SPSS version 20. Pairwise compar\ison and post-hoc analysis between groups were carried out using Bonferroni correction after one-way ANOVA. Area under the receiver operating characteristic (AROC) curves were plotted to determine the diagnostic ability of the tests. A p- value of < 0.05 was considered significant.
The study protocol adhered to ethical considerations and ethical principles set out in relevant guidelines, including the Declaration of Helsinki, World Health Organization guidelines, International Conference on Harmonization – Good Clinical Practice, and National Ethics Guidelines for Health Research. The study commenced upon approval by the SLMC Institutional Ethics Review Committee. Written informed consent was obtained, either in English or Filipino, from all participants by the primary investigator. No subject withdrew their participation in this study or reported any adverse events during the entire study period.
RESULTS
A total of 22 glaucomatous subjects (15 POAG and 7 NTG eyes), 22 contralateral eyes-at-risk, and 22 normal eyes from age- and sex-matched controls were included in the study. All 22 unilateral glaucoma subjects and 22 controls had BP measurements and a comprehensive eye exam on the same day as the OCT-A exam.
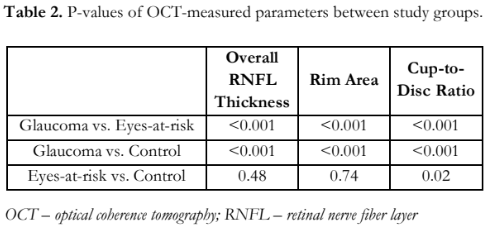
The demographic information and structural clinical measurements are summarized in Table 1. Among the three groups, no significant differences were detected with age, gender, laterality, systolic BP, diastolic BP, and MAP. For clinical and structural measurements, significant differences were observed in terms of BCVA, IOP, MOPP, and all the OCT parameters (Table 2).
OCT and OCT-A images of a representative subject with unilateral glaucoma, contralateral at-risk eye, and a normal control are shown in Figure 1.
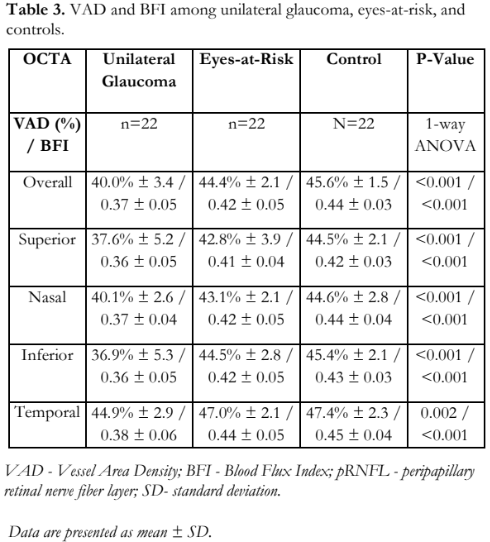
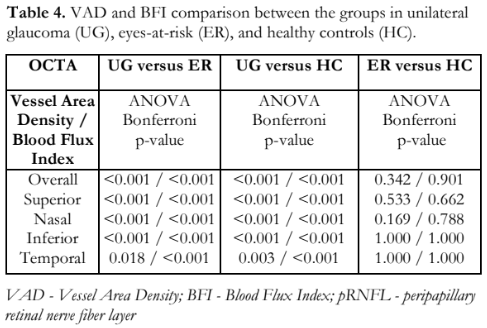
The overall and quadrant peripapillary VAD and BFI values in glaucomatous, at-risk, and control eyes (Table 3) indicated that at least one group had a significantly different mean VAD and mean BFI. Pairwise comparisons revealed that eyes with glaucoma had a significantly lower mean overall VAD compared to at-risk and control eyes (Table 4), and significantly lower mean overall BFI compared to the other 2 groups. There was no significant difference between the at-risk and control groups (Table 4). Quadrant analyses of VAD and BFI also showed significantly lower percentages in the glaucoma when compared to the other two groups and no differences between at-risk and control groups.
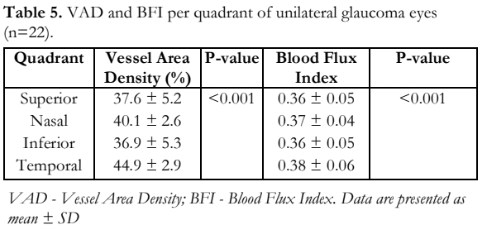
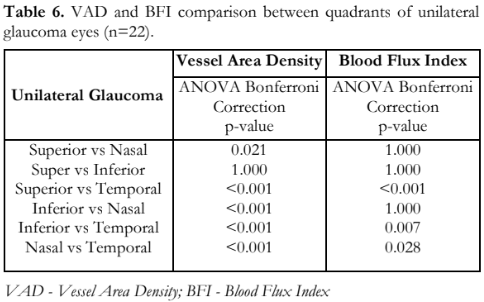
The mean peripapillary microvascular parameters (VAD and BFI) per quadrant among eyes with unilateral glaucoma indicated that at least one of the four quadrants had significantly different mean VAD (p < 0.001) and BFI (p < 0.001) values (Table 5). When comparing the different quadrants of the glaucomatous eyes, all showed significant differences between the different quadrants for VAD, except between superior and inferior (Table 6). For BFI, only the superior vs. nasal, superior vs. inferior, and inferior vs. nasal did not show any difference.

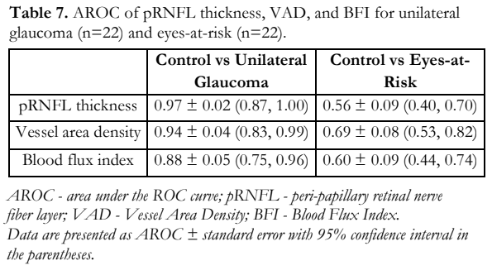
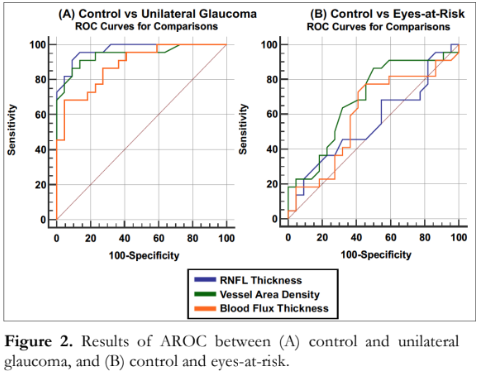
The area under the receiver operating characteristic curve (AROC), which measures the diagnostic ability and usefulness of a test in discriminating normal from glaucomatous eyes, was highest for overall peripapillary RNFL thickness, followed by overall vessel area density, and blood flux index (Table 7). When comparing RNFL vs. VAD, RNFL vs. BFI, and VAD vs, BFI, no significant differences were observed (p values of 0.46, 0.07, and 0.27, respectively). In discriminating control vs. eyes-at-risk, overall VAD showed the highest AROC, followed by BFI, and RNFL thickness (Table 7). No significant differences were found among all three metrics (p > 0.05) (Figure 2).
DISCUSSION
This case-control study looked into the peripapillary microvascular circulation of unilateral POAG and NTG eyes, contralateral eyes-at-risk, and age- and sex-matched healthy controls using OCT-A parameters. Significant reductions in VAD and BFI were detected in glaucomatous eyes compared to contralateral eyes and control. In addition, the pattern of significantly decreased vascular parameters in the superior and inferior quadrants was consistent with the common area of thinning involving the RNFL polar arcuate bundles.35,36 This study showed that the diagnostic accuracies of VAD and BFI for glaucoma are comparable with that of overall pRNFL thickness and that both parameters have good discriminatory power between glaucomatous and normal eyes. Significant reductions in overall VAD and BFI, specifically in the superior and inferior quadrants compared to other areas, are consistent with the pattern of RNFL loss in glaucoma.
Physiologically, better vascularity and flow are consistent with improved homeostasis, metabolism, and better overall function.9 While there is conflicting evidence regarding the effect of hypertension in glaucoma, this study observed that MOPP was significantly lower in glaucomatous eyes compared with contralateral and control eyes. This observation was consistent with the findings of Vawda et al. that increasing perfusion, in particular MOPP, leads to decreased risk of thinning in the total ganglion cell and RNFL thickness.37
While it is regarded that most patients diagnosed with unilateral glaucoma will eventually progress bilaterally38, our study did not observe any significant difference between eyes-at-risk and healthy controls across all measured parameters. In both groups, VAD and BFI were highest in the temporal quadrant, followed by the inferior, nasal, and superior quadrants. Contrary to normal RNFL measurements which are thickest in the superior and inferior quadrants, this research showed that peripapillary microvascular distribution are denser in the temporal region, which was similar to the observations made in the study by Ghassemi et al.39
While overall pRNFL thickness showed highest diagnostic accuracy for glaucoma, the AROC revealed no significant difference when compared to VAD and BFI. For eyes-at-risk, the AROC was highest with VAD, followed by BFI, and pRNFL thickness; with no significant differences detected among all comparisons. This study showed that OCT-A parameters are comparable with pRNFL thickness and can be utilized in glaucoma diagnosis.
This study presents some limitations. The cross-sectional case-control design limits the optimal observation of subjects over time, with likely confounding variables such as BP and IOP fluctuation (e.g. tests were not done during the scan), effects of systemic and topical anti-hypertensive medications, and hyper- and hypoxic conditions and events, which can all lead to possible variability in OCT-A parameters. Likewise, this study did not look into the VF indices and the pattern of field loss in relation to areas of vascular attenuation noted in OCT-A. A prospective longitudinal study is warranted to answer the biggest question of whether vascular dysfunction precedes RNFL damage or structural tissue loss leads to less demand for perfusion.
This is the first study in the Philippines to investigate the utility of OCT-A parameters in the diagnosis of glaucoma. While the value of OCT-A in the field of retina is established, better utilization, more evidence, including the data from this study, is still needed to validate the role of OCT-A in glaucoma diagnosis, especially in the early, pre-OCT stage of the disease.
Our study utilized a double control, where the normal contralateral eye, and age- and sex-matched healthy subjects were enrolled, and compared them to the unilateral glaucomatous eyes. A good direction for future research is the addition of age- and sex- matched glaucoma suspects. Our study only included POAG and NTG with varying disease severity to have a better clinical representation and to limit the confounding variables brought about by angle closure and secondary glaucomas.
In conclusion, this study showed that peripapillary microvascular parameters were significantly reduced in unilateral POAG and NTG as measured by OCT-A. VAD and BFI are comparable to pRNFL thickness in their utility in diagnosing glaucoma and may serve as additional structural parameters for glaucoma detection and follow-up. Quantification of VAD and BFI using OCT-A might provide evidence into our understanding of the pathophysiology of glaucoma and might direct future studies on glaucoma management.
REFERENCES
- Flaxman SR, Bourne RRA, Resnikoff S, et al. Global causes of blindness and distance vision impairment 1990–2020: a systematic review and meta-analysis. Lancet Glob Health 2017; 5: e1221–e1234
- Choi J, Kook MS. Systemic and ocular hemodynamic risk factors in glaucoma. Biomed Res Int 2015;2015:141905 {check this reference for vol and pages].
- The Advanced Glaucoma Intervention Study (AGIS): 7. The relationship between control of intraocular pressure and visual field deterioration. Am J Ophthalmol 2000;130(4):429-40.
- Lemij H. Glaucoma diagnosis: the role of optic nerve examination. Eur Ophthal Rev; 2007:15-7.
- Ahmad SS. Controversies in the vascular theory of glaucomatous optic nerve degeneration. Taiwan J Ophthalmol 2016;6(4):182–86.
- Agarwal R, Gupta SK, Agarwal P, et al. Current concepts in the pathophysiology of glaucoma. Indian J Ophthalmol 2009;57(4):257–66.
- Mozaffarieh M, Flammer J. The mechanism of glaucomatous damage to the optic nerve. Eur Ophthal Rev 2009;3:33-35.
- Wirostko BM, Ehrlich R, Harris A. The vascular theory in glaucoma. Glaucoma Today April 2009:25-27.
- Osborne NN, Melena J, Chidlow G, et al. A hypothesis to explain ganglion cell death caused by vascular insults at the optic nerve head: possible implication for the treatment of glaucoma. Br J Ophthalmol 2001;85:1252-59.
- Flammer J, Konieczka K, Flammer AJ. The role of ocular blood flow in the pathogenesis of glaucomatous damage. US Ophthal Rev 2011;4:84-87.
- Flammer J, Orgül S, Costa VP, et al. The impact of ocular blood flow in glaucoma. Prog Retin Eye Res 2002;21(4):359- 93.
- Resch H, Garhofer G, Fuchsjager-Mayrl G, et al. Endothelial dysfunction in glaucoma. Acta Opthalmol. 2009;87:4-12.
- Dienstbier E, Balik J, Kafka H. A contribution to the theory of the vascular origin of glaucoma. Br J Ophthalmol 1950;34:47–58.
- Hayreh SS. Pathophysiology of glaucomatous optic neuropathy: role of optic nerve head vascular insufficiency. J Curr Glau Prac 2008;2:5–17.
- Jia Y, Morrison JC, Tokayer J, et al. Quantitative OCT angiography of optic nerve head blood flow. Biomed Opt Express. 2012;3:3127–37.
- de Leon JM, Cheung CY, Wong TY, et al. Retinal vascular caliber between eyes with asymmetric glaucoma. Graefes Arch Clin Exp Ophthalmol 2015;253(4):583-9.
- Memarzadeh F, Ying-lai M, Chung J, et al. Los Angeles Latino Eye Study Group. Blood pressure, perfusion pressure, and open-angle glaucoma: the Los Angeles Latino Eye Study. Invest Ophthalmol Vis Sci 2010;51:2872– 77.
- Tielsch JM, Katz J, Singh K, et al. A population-based evaluation of glaucoma screening: the Baltimore Eye Survey. Am J Epidemiol 1991;134:1102–10.
- Zhao D, Cho J, Kim MH, et al. The association of blood pressure and primary open-angle glaucoma: a meta- analysis. Am J Ophthalmol 2014;158(3):615-27.
- Novotny HR, Alvis DL. A method of photographing fluorescence in circulating blood in the human retina. Circulation 1961;24:82–6.
- Kotsolis AI, Killian FA, Ladas ID, et al. Fluorescein angiography and OCT concordance for choroidal neovascularization in multifocal choroiditis. Br J Ophthalmol 2010;94:1506–8.
- Leitgeb RA, Werkmeister RM, Blatter C, et al. Doppler OCT. Prog Retin Eye Res 2014; 41: 26–43.
- Yazdanfar S, Rollins AM, Izatt JA. Imaging and velocimetry of the human retinal circulation with color Doppler OCT. Opt Lett.2000; 25: 1448–50.
- Petrig BL, Riva CE, Hayreh SS. Laser doppler flowmetry and optic nerve head blood flow. Am J Ophthalmol 1999;127(4):413–25.
- Sugiyama T, Araie M, Riva CE, et al. Use of laser speckle flowgraphy in ocular blood flow research. Acta Ophthalmol 2010;88(7):723–29.
- Liu L, Jia Y, Takusagawa HL, et al. Optical coherence tomography angiography of the peripapillary retina in glaucoma. JAMA Ophthalmol 2015; 133(9):1045–52.
- Yarmohammadi A, Zangwill LM, Diniz-Filho A, et al. Optical coherence tomography angiography vessel density in healthy, glaucoma suspect, and glaucoma eyes. Invest Ophthalmol Vis Sci 2016; 57(9):451–9.
- Rao HL, Pradhan ZS, Weinreb RN, et al. Regional comparisons of optical coherence tomography angiography vessel density in primary open-angle glaucoma. Am J Ophthalmol 2016; 171:75–83.
- Yarmohammadi A, Zangwill LM, Diniz-Filho A. Peripapillary and macular vessel density in patients with glaucoma and single-hemifield visual field defect. Ophthalmology 2017;124(5):709–19.
- Yarmohammadi A, Zangwill LM, Manalastas PIC. Peripapillary and macular vessel density in patients with primary open-angle glaucoma and unilateral visual field loss. Ophthalmology. 2018;125(4):578–87.
- Moghimi S, SafiZadeh M, Xu BY, et al. Vessel density and retinal nerve fibre layer thickness following acute primary angle closure. Br J Ophthalmol 2020 ;104(8):1103-08.
- Mangouritsas G, Koutropoulou N, Ragkousis A, et al. Peripapillary vessel density in unilateral preperimetric glaucoma. Clin Ophthalmol 2019;13:2511-19.
- Choi WJ, Qin W, Chen C-L, et al. Characterizing relationship between optical microangiography signals and capillary flow using microfluidic channels. Biomed Opt Express 2016; 7: 2709–28.
- Chen C-L, Zhang A, Bojikian KD, et al. Peripapillary retinal nerve fiber layer vascular microcirculation in glaucoma using optical coherence tomography–based microangiography. Invest Ophthalmol Vis Sci 2016;57:475– 85.
- Diniz-Filho A, Abe RY, Zangwill LM, et al. Association between intraocular pressure and rates of retinal nerve fiber layer loss measured by optical coherence tomography. Ophthalmology 2016;123(10):2058-65.
- Wessel JM, Horn FK, Tornow RP, et al. Longitudinal analysis of progression in glaucoma using spectral-domain optical coherence tomography Invest Ophthalmol Vis Sci 2013; 54 (5): 3613-20.
- Vawda N, Munsamy A. The effect of ocular perfusion pressure on retinal thickness in young people with presumed systemic hypotension. Vision 2021;5(3):36.
- Niziol LM, Gillespie BW, Musch DC. Association of fellow eye with study eye disease trajectories and need for fellow eye treatment in Collaborative Initial Glaucoma Treatment Study (CIGTS) participants. JAMA Ophthalmol 2018;136(10):1149-56.
- Ghassemi F, Berijani S, Roohipoor R, et al. Vascular density of optic nerve head in diabetic retinopathy using optical coherence tomography angiography. Int J Retin Vitr 2020; 6 (1): 62