Correlation of structure and function in glaucoma
Maria Joanna Rodriguez-Chan, MD, Patricia M. Khu, MD, MS, Ma. Margarita L. Luna, MD, Manuel B. Agulto, MD
GLAUCOMA is defined as a progressive, chronic optic neuropathy with characteristic morphological and structural changes in the optic-nerve head (ONH) manifested by neuroretinal-rim thinning and increased cupping, associated with loss of retinal ganglion cells (RGCs) and their axons (retinal-nerve-fiber layer or RNFL), coupled with functional changes demonstrated by specific visual-field defects.1-3
Nerve fibers enter the optic nerve from the retina in a characteristic “arcuate” anatomic pattern. Most of the arcuate fibers enter the superior and inferior poles of the optic disc giving a double-hump configuration on measurements of the RNFL, indicating thicker areas. Those areas are also more susceptible to damage where the earliest defects are usually manifested as RNFL thinning in the superior or inferior quadrant of the ONH, associated with visual-field depressions in the superior or inferior arcuate regions of the visual field. Thus, the hallmark of glaucoma clinically is the nerve-fiber-bundle defect. Visual-field damage is noted to have a linear relationship to the number of axons and ganglia lost.4
The degree of glaucoma damage is based on visual-field defects and ONH changes. Mild damage is characterized by early visual-field defects in one hemisphere with mean deviation, the measure of overall field loss, less than –6 decibels, and early thinning of the neuroretinal rim. Moderate damage shows definite arcuate scotomas in both hemispheres and more extensive thinning of the neuroretinal rim. Severe glaucomatous damage shows extensive visualfield loss with involvement of the central five-degree field and generalized thinning of the neuroretinal rim associated with marked cupping to the rim.2 These changes can be documented using disc photography, standard achromatic perimetry (SAP), and optical coherence tomography (OCT).
Recent randomized clinical trials, including the Ocular Hypertension Treatment Study (OHTS) and European Glaucoma Prevention Study, reported that the initial damage in glaucoma can either be structural or functional, both of which can be monitored using specific diagnostic tests.5-6
Several studies have reported the diagnostic properties of the different tests in glaucoma.7-15 More recently, Shah and associates showed the sensitivity and specificity of OCT at 58.1% and 98.3%, frequency-doubling technology (FDT) of 44.2% and 98.3%, and short-wavelength automated perimetry (SWAP) of 65.1% and 86.2%, respectively, and concluded that a combination of parameters from structural and functional tests improves the sensitivity of glaucoma detection. 7
Most diagnostic tests are more sensitive in detecting “definite” glaucoma where findings in the ONH and visual fields are obvious. Measures of diagnostic accuracy obtained from these studies have included mostly patients with moderate to severe disease and may, therefore, not be reflective of patients in the early stage. Thus, a study evaluating different diagnostic tests should include a broad range of patients with the disease so that the performance of the test is applicable to many.
This study assessed the relationship of two structural tests, specifically optic-disc photography and OCT, and a functional test, specifically SAP, in the diagnosis of glaucoma. The sensitivities, specificities, and predictive values of the structural and functional tests were calculated.
METHODOLOGY
A review of clinic charts from the database of a private glaucoma specialist and the Glaucoma Clinic of the University of the Philippines–Philippine General Hospital (UP–PGH) was done. A total of 7,673 charts were reviewed, of which 2,951 were derived from the database of the private glaucoma specialist and 4,722 from the glaucoma clinic. Only patients with complete disc photos, OCT, and SAP done within 6 months of each other were included. They should also have undergone a comprehensive eye evaluation that included best-corrected visual acuity (BCVA), slitlamp biomicroscopy, intraocular-pressure measurements by Goldmann applanantion tonometry, gonioscopy, and dilated funduscopic examination. Excluded were patients with coexisting retinal disease, uveitis, or nonglaucomatous optic neuropathy.
For grading of the 3 diagnostic tests by 2 glaucoma experts, a standardized checklist was devised taking into account the features in the optic disc, the objective parame-ters used in SAP, and the measurements employed in OCT. With no available patient clinical data, the printouts of the optic-disc photo, OCT, and SAP were separated and individually placed in envelopes numerically coded. Each envelope contained a specific checklist for the particular diagnostic exam being evaluated. Each of the printouts of the diagnostic examinations was interpreted and evaluated, compiled, and correlated with each other by the 2 glaucoma experts working separately. When the interpretations of the 2 experts differed, the diagnosis of the attending glaucoma expert was used.
Sensitivities, specificities, and predictive values were calculated for the best structural parameter, functional parameters, and for the combination of one structural and one functional parameter.
Data were encoded and tallied in SPSS (Statistical Package for Social Sciences, Chicago, IL) version 10 for Windows. Descriptive statistics were generated for all variables. For nominal data, frequencies and percentages were computed. For numerical data, mean and standard deviation, the median and the range were generated. Kappa statistics were used to determine interobserver variability. Two-by-two tables were generated and computed for sensitivities, specificies, and predictive values.
RESULTS
A total of 188 (2.45%) charts out of the 7,673 reviewed were included in the study. The charts contained the three diagnostic examinations—optic-disc photograph, OCT, and SAP, all done within six months of each other. Of the 188 charts, 146 (77.7%) were taken from the 2,951 charts of a private glaucoma specialist and 42 (22.3%) from the 4,722 charts of the glaucoma clinic. Three hundred sixtyseven eyes were included in the study, with 161 (43.9%) eyes diagnosed clinically as nonglau-comatous and 206 (56.1%) with different degrees of glaucoma damage.
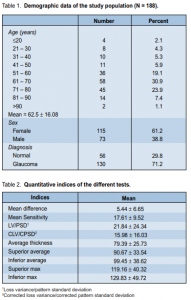
The mean age of the study population was 62.5 ± 16.08 years; median was 66. Most of the patients (73.9%) were in the 50 to 80 years age group, of which 30.9% were from the 61 to 70 age range. There were 115 females and 73 males (Table 1).
For the quantitative indices in the SAP, the mean defect (MD) of the study population was 5.45 ± 6.65, while the mean sensitivity (MS) was 17.61 ± 9.52. Loss variance or pattern standard deviation was 21.84 ± 24.34. In the OCT examination, the mean and median values for the CD ratio of the study population was 0.72 ± 0.16 and the mode was 0.89. Mean disc diameter was 1.93 ± 0.36, while mean rim area was 1.09 ± 0.62. Interpreted as glaucoma was 54.42% of eyes based on the RNFL analyses. The RNFL thickness in the superior and inferior regions of the ONH are shown in Table 2.
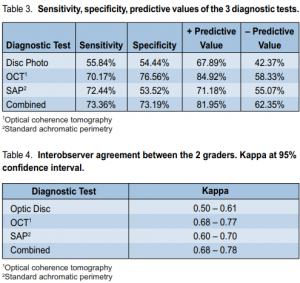
In diagnosing glaucoma, optic-disc photos registered 55.84% sensitivity and 54.44% specificity, with a positive predictive value of 67.89% and a negative predictive value of 42.37%. Interobser ver agreement was 0.50 to 0.61(Tables 3 and 4).
SAP had 72.44% sensitivity and 53.52% specificity, with a positive predictive value of 71.18% and a negative predictive value of 55.07%. Interobserver agreement was 0.60 to 0.70 (Tables 3 and 4).
OCT registered 70.71% sensitivity and 76.56% specificity, with a positive predictive value of 84.92% and a negative predictive value of 58.33%. Interobserver agreement was 0.68 to 0.77 (Tables 3 and 4).
Correlation of all three examinations showed 73.36% sensitivity and 73.19% specificity, with a positive predictive value of 81.95% and a negative predictive value of 62.35%. Interobserver agreement was 0.68 to 0.78 (Tables 3 and 4).
Interobserver reliability was computed for each of the three examinations, and for the correlation of the examinations as a whole. Interobserver difference occurred in 81 of the 367 optic-disc photos graded by the experts, with an interobserver reliability of 88.93%. In SAP, there was a different interpretation in 37 of 367 eyes, with an interobserver reliability of 89.92%. In OCT, there was an interobserver difference in 15 of the 367 eyes, giving a 95.91% interobserver reliability.
DISCUSSION
Previous studies have shown that the diagnostic precision of the qualitative evaluation of stereoscopic opticdisc photographs by experienced clinicians is superior to any other currently available method of optic-disc assessment.1, 3-4 Evaluation of the optic disc with the benefit of stereophotography is said to be the “gold standard” for the diagnosis and monitoring of early to moderate glaucoma.3 In this study, lower sensitivity (55.84%) and specificity (54.44%) were obtained for nonstereo disc photographs with interobserver reliability of only 88.93% and kappa values ranging from 0.50 to 0.61, showing fair agreement. Current studies utilizing stereo photographs revealed much higher interobserver agreements, with kappa values ranging from 0.55 to 0.81.3 This difference could be attributed to the current limitation of optic-disc photography in our practice that did not employ stereo. Evaluation of stereo optic-disc photos gives the added advantage of assessing depth of the optic cup with better delineation of the cup borders and changes in vessel contour. Moreover, standardized technique of obtaining the photos should be followed to include standard magnification so that disc size can be estimated, clear focus, standard lighting so that color of the rim may be evaluated, stereopsis so that vessel contour and bending can be assessed. In addition, red-free photographs should be included to assess nerve-fiber-layer defects. Many of the photos in the study were substandard and most likely interfered with the grading. In spite of the limitations of optic-disc photos, they still provide a hard copy of the opticnerve head and RNFL which clinicians can obtain easily and use for documentation and qualitative monitoring.
SAP has a higher sensitivity than specificity in this study and this is not surprising since the test has a higher false positive than false negative errors due to the learning effect of the test. SAP is not fully automated and relies heavily on patient’s responses. Other factors can also affect the test result, such as uncorrected refractive errors, media opacity, small pupil, and edge artifacts. Because of all these, the predictive value of the test for ruling out glaucoma is only 55%. This also indicates that screening for glaucoma with SAP is not efficient, as a high rate of false-positive errors can be costly.
OCT provided much higher sensitivity and specificity in this study since it is a more objective test than SAP or disc photos. SAP provides test indices, such as the mean defect (MD), mean sensitivity (MS), and pattern SD or loss variance as indicators for diffuse or focal loss. They are also affected by artifacts and test reliability. OCT is less patient-dependent, utilizes nerve-fiber measurements in different quadrants that are compared with a normative database, and gives probability scores. Optic-disc parameters, such as disc size and rim area including volume, are also obtained, assisting in the evaluation of the optic nerve. Overall, OCT is more objective with higher predictive values and fairly good interobserver agreement compared with the other 2 diagnostic tests. Other studies showed similar results with good agreement (kappa = 0.51-0.73) in diagnosing glaucoma using OCT printouts and high sensitivities (76 to 79%) and specificities (68 to 81%).8
When the 3 diagnostic tests were combined and used to diagnose the presence or absence of glaucoma, much higher sensitivity and specificity were obtained in this study. Moreover, the ability to predict that glaucoma is present or absent also increased dramatically. Other studies showed similar results, indicating that the diagnosis of glaucoma is a combination of detecting structural and functional defects.
In summary, higher sensitivity and specificity were obtained for both objective tests, such as the OCT and the SAP. Correlating both structural and functional tests would increase the predictive values of the tests, thereby increasing the likelihood of a more accurate diagnosis.
1.Allingham RR, Damji KF, Freedman S, et al. Shields’ Textbook of Glaucoma, 5th ed. Philadelphia: Lippincott Williams & Wilkins, 2005.
2.American Academy of Ophthalmology. Basic and Clinical Science Course: Glaucoma, 2004-2005, Section 10; 3-4, 44-80.
3.Weinreb RN, Greve EL. Glaucoma Diagnosis. Structure and Function. The Hague, Netherlands: Kugler Publications, 2004.
4.Keltner JL, Johnson CA, Anderson DR, et al. The association between glaucomatous visual fields and optic-nerve-head features in the Ocular Hypertension Treatment Study. Ophthalmology 2006; 113: 1603-1612.
5.Kass MA, Heuer DK, Higginbotham EJ, et al. The Ocular Hypertension Treatment Study: a randomized trial determines that topical ocular hypotensive medication delays or prevents the onset of primary open-angle glaucoma. Arch Ophthalmol 2002; 120: 701-713.
6.European Glaucoma Prevention Study (EGPS) Group. Results of the European Glaucoma Prevention Study. Ophthalmology 2005; 112: 366-375.
7.Shah NN, Bowd C, Medeiros FA, et al. Combining structural and functional testing for detection of glaucoma. Ophthalmology 2006; 113: 1593-1602.
8.Sanchez-Galeana C, Bowd C, Blumenthal EZ, et al. Using optical imaging summary data to detect glaucoma. Ophthalmology 2001; 108: 1812-1818.
9.Khu PM, Aquino NM, Lat-Luna MM, et al. Understanding structure and function in glaucoma. Philipp J Ophthalmol 2006; 31:84-91.
10.Blumenthal EZ, Williams JM, Weinreb RN, et al. Reproducibility of nerve-fiber-layerthickness measurements by use of optical coherence tomography. Ophthalmology 2000; 107: 2278-2282.
12.Schuman JS, Pedut-Kloizman T, Hertzmark E, et al. Reproducibility of nerve fiber layer thickness measurements using optical coherence tomography. Ophthalmology 1996; 103: 1889-1898.
14.Bowd C, Zangwill LM, Medeiros FA, et al. Confocal scanning laser ophthalmoscopy classifiers and stereophotograph evaluation for prediction of visual-field abnormalities in glaucoma-suspect eyes. Invest Ophthalmol Vis Sci 2004; 45: 2255-2262.
15.Bowd C, Zangwill LM, Medeiros FA, et al. Structure-function relationships using confocal scanning laser ophthalmoscopy, optical coherence tomography, and scanning laser polarimetry. Invest Ophthalmol Vis Sci 2006; 47: 2889-2895.
16.Sample PA, Medeiros FA, Racette L, et al. Identifying glaucomatous vision loss with visual-function-specific perimetry in the diagnostic innovations in glaucoma study. Invest Ophthalmol Vis Sci 2006; 47: 3381-3389.
17.Medeiros FA, Sample PA, Zangwill LM, et al. A statistical approach to the evaluation of covariate effects on the receiver-operating characteristic curves of diagnostic tests in glaucoma. Invest Ophthalmol Vis Sci 2006; 47: 2520-2527.