Color-vision abnormalities among patients undergoing tuberculosis treatment
Emerson M. Cruz, MD,Frances G. Puentespina, MD,Karlo Paolo L. Alejo, MD,Evelyn T. Santos-Morabe, MD,Ma. Lourdes R. Nañagas, MD
TUBERCULOSIS remains a significant health problem worldwide, particularly in developing countries like the Philippines, where in 2005, it ranked sixth among the causes of mortality (31.2/100,000 population)1 and morbidity (134.1/100,000).2 In the last World Health Organization (WHO) survey in 2006, the Philippines ranked second in TB prevalence in the Western Pacific Region.
Together with Cambodia, China, and Laos, the Philippines accounted for 93% of TB mortality in the region, placing the country among the 22 high-burden countries in the world.3 In 1996, the WHO endorsed the directly observed treatment short-course (DOTS) strategy to decrease the TB burden. This six-month course of directly observed treatment uses a combination of 4 drugs—pyrazinamide, ethambutol, isoniazid, and rifampicin—for the first 2 months, after which pyrazinamide and ethambutol may be discontinued if sputum microscopy is already negative. As in all therapeutic interventions, side effects are expected. Drug-induced optic neuropathy causing blurring of vision is among the possible adverse effects of anti-TB therapy. Both isoniazid and ethambutol have been reported to cause optic neuropathy.4 While the blurring of vision associated with toxic optic neuropathy is often reversible, there are reports of irreversible vision loss. Inocencio and Castillo reported that 26 out of 34 patients they studied had irreversible optic atrophy, presumably from anti-TB therapy.5 A case study by Su-Ann Lim of Singapore reported irreversible loss of visual function among 3 cases of ethambutolassociated optic neuropathy.6 The toxic effects were likely to depend on the dose and duration of treatment.7 Some patients on antituberculosis drugs, particularly ethambutol, have been reported to complain of colorvision disturbance during treatment despite normal visual acuity.8 This suggests that color-vision test might be useful in the early detection of ethambutol toxic optic neuropathy, even before visual acuity is affected. A study on prevalence of color-vision abnormalities among highschool students at the Cayetano (Manila North) Arellano High School had an interesting incidental finding: 5 patients who showed tritan color-vision abnormality had a history of anti-TB therapy.9 This finding prompted us to undertake this study to determine the extent of druginduced color-vision abnormalities among patients being treated for tuberculosis. The patients at the local DOTS centers were considered an ideal target population because the criteria for inclusion in the program required adequate documentation of the infection and the DOTS strategy made sure that the patients were taking the drugs as prescribed. A 1998 study in the Democratic Republic of Congo revealed that 15 out of 42 patients (36%) showed color vision defects after 5 months of ethambutol treatment even before visual acuity and visual fields were affected.8 Polak documented color-vision changes in the presence of normal visual acuity, visual fields, visual-evoked potentials, and panel D-15 test.10 On the other hand, a recent prospective study from India reported no color-vision changes after testing with Ishihara plates and Oculus Heidelberger Anomaloscope among patients under DOTS.11 Their study showed that results of visual-evoked response and visual-field examinations can help identify cases likely to develop early toxicity. Despite the heavy TB burden and the potential of treatment to cause ocular problems, there remains a paucity of local literature on this subject. This study was, therefore, undertaken to determine the incidence of color-vision abnormalities, their type, and the risk factors for their development among patients on DOTS. Data obtained from this study may prove useful in detecting early toxicity from antituberculosis therapy so that appropriate intervention could be instituted to minimize irreversible visual loss.
METHODOLOGY
A prospective, single-cohort study was conducted among newly diagnosed category-1 tuberculosis patients enrolled in DOTS health centers in the City of Manila from February to August 2009. A single-stage cluster sampling through draw lots was adopted to select a representative sample of the population. DOTS health centers in districts I, II, III served as cluster sites. The study protocol was approved by the Department of Ophthalmology of Jose R. Reyes Memorial Medical Center (JRMMC), Manila Health Department, and the Division of Planning and Coordination of the city government of Manila, and the study was conducted in accordance with their recommendations. A total of 93 newly diagnosed category one tuberculosis patients, as identified and classified by the stern criteria set by the WHO-DOTS program, were included. The local DOTS health center provided the drugs for free and made sure the patients took them as prescribed. For the first 2 months, the patients were given a fixeddose combination of 4 drugs—pyrazinamide (400 mg), ethambutol (275 mg), isoniazid (75 mg), and rifampicin (150 mg). After 2 months, if repeat sputum examination revealed negative results, the treatment was reduced to isoniazid and rifampicin. For those with positive sputumtest results, quadruple therapy was extended for another month or until sputum exam turned negative. A DOTS health center staff administered the medicine to ensure 100% compliance with the therapy. Participants were examined at the outpatient department of JRMMC. Informed consent was obtained after thorough explanation of the nature and possible benefits of the study. The participants underwent an eye evaluation consisting of detailed history, best-corrected visual acuity (Snellen Chart converted to decimal system), direct funduscopy examination, anterior-segment slitlamp biomicroscopy, applanation tonometry, and color-vision testing (Ishihara Pseudoisochromatic Plates, Farnsworth Panel D-15, and Lanthony D-15 Desaturated). The height and weight of the patients were also obtained to compute the body-mass index (BMI), and categorized using the WHO classification as underweight (<18.5), normal (18.5 to 24.9), overweight (25 to 29.9), or obese (30 or greater).12 Excluded were patients who had category-2 tuberculosis (multidrug resistant); had undergone previous anti-TB therapy; had other ocular disease that may alter the parameters being investigated; were taking oral contraceptives, digoxin, and other medications implicated in causing color-vision deficiency; and had color-vision deficiency at baseline. Baseline examination was done before the start of the therapy and every month thereafter up to conclusion of therapy. A single investigator assessed the color vision using the full series of the Ishihara Color Vision Plates (Ishihara), Farnsworth Panel D-15 (FD 15), and Lanthony Desaturated D-15 (Lanthony). Subjects were tested binocularly while wearing best correction. Testing with the Ishihara was done in a room with adequate daylight. The patient was positioned with the color-vision plates held 75 centimeters away and tilted so that the plane of the paper was perpendicular to the line of vision. A normal reading of all plates was deemed normal. If a subject read 9 or fewer plates correctly, color vision was regarded as deficient.13 The FD15 and Lanthony tests were done using the Color Vision Recorder software, version 4 (Optical Diagnostics, Netherlands), and a Dell Inspiron computer. The screen color was calibrated based on the standards set by the International Color Consortium (ICC). In these color arrangement tests, the subject was offered a series of colors that needed to be sorted either in a sequence or into groups. The patient’s task was to identify the cap that most closely resembled the reference cap in color and place it next to the reference cap. This process was repeated until all removable caps were placed in color order. For both FD15 and Lanthony tests, a horseshoe diagram was drawn which was a graphical presentation of the cap order. The type of color deficiency was determined from the horseshoe diagram by evaluating in what directions the crossings were made.14 The final diagnosis consisted of two parts—the pass/ fail diagnosis, which was automatically set by the software based on the number of errors made by the patient, and the type of color deficiency of the patient determined by unresolved crossing. Both tests were conducted thrice to verify the result. Patients requiring assistance with clicking or dragging the mouse were helped while taking care not to affect their responses. Patients who incurred absences within the first 2 months of follow-up evaluation were dropped from the study. Those who failed 2 tests out of the three within a single visit were referred to their attending physician for reevaluation of their medications and possible drug withdrawal. The patients were then subjected to close follow-up for any improvement or deterioration after drug withdrawal. Patients who failed 1 out of the 3 tests were kept in the study and monitored closely for visual symptoms. Sample-population calculation was performed to ensure validity of the target number of subjects.
Assuming a 5% difference between baseline and the study group, a positive color-vision abnormality of ≥36% at baseline, a power of 80%, and ± error of 5% using the formula of Fleiss15 revealed a total sample size of 52 subjects. The design was prospective, single-cohort study with the patients serving as their own control. The demographic and clinical data were collated and analyzed. Differences between baseline and follow-up findings were noted. The Student’s t-test and chi-square tests were used, with p value equal to or less than 0.05 considered statistically significant. Multivariate statistical analysis was done to determine the association of clinical variables with induced color-vision abnormalities.
RESULTS
From February to August 2009, 93 patients newly diagnosed with category-1 tuberculosis were enrolled in the study. Three subjects were excluded because of the presence of red-green color deficiency at baseline exam, 1 because of retinal detachment, and 25 because of failure to complete the follow-ups. Sixty-four patients completed the prescribed number of follow-ups and constituted the study group. There were 47 males and 17 females, aged 13 to 75 years (mean 38.67 ± 15.96). All patients were given a fixed-dose combination of rifampicin, isoniazid, ethambutol, and pyrazinamide for 60 days. Since all patients converted to sputum negative smears after 2 months, therapy was shifted to rifampicin and isoniazid only for the succeeding 4 months to complete the 6-month therapy. At baseline, visual acuity ranged from 20/20 (1.00) to 20/70 (0.30) with a mean of 0.88 ± 0.18 (Table 1). Anterior-segment slit-lamp and direct funduscopy findings were all normal. Color-vision testing before the start of therapy showed that all patients had normal color-vision using the Ishihara, FD 15, and Lanthony tests. After 1 month (average 39.65 days) of quadruple therapy,
Table 1. Demographic profile of the study population

evaluation of all the baseline parameters was repeated. All subjects had normal color vision using the Ishihara plates. However, one (1.56%) out of the 64 failed the FD15 and was classified as having blue-yellow deficiency (tritan). Thirty (46.88%) failed the Lanthony test. Since baseline tests of these patients were normal, the color-vision deficiency detected by the Lanthony test was presumed to be drug-induced. The type of color-vision deficiency was unclassified in 20 subjects (66%) and tritan in 10 (33%). There was no significant correlation between the occurrence and type of color-vision deficiency with age, gender, and BMI (Table 2). After 2 months of quadruple treatment, ethambutol and pyrazinamide were discontinued. On the third month follow-up, which was an average of 72.63 days (range 69 to 76 days) from baseline, or more or less 12 days after
discontinuation of ethambutol, the patients underwent the same ophthalmologic examination and colorvision
tests. All subjects had normal Ishihara and FD15 tests. The lone patient who failed the FD15 while on quadruple therapy had reverted to normal. Five subjects still failed the Lanthony test. The 25 other patients who failed the test while on quadruple therapy had reverted to normal within an average of 12 days (range, 8 to 16) after discontinuing ethambutol and pyrazinamide. The type of color-vision defect was unclassified in 3 (60%) and tritan in 2 patients (40%). There was a statistically significant difference in the proportion of patients with abnormal findings between the Ishihara, FD15, and Lanthony tests after the second month of treatment (p = 0.02). On the fourth month follow-up, about 30 days after discontinuing ethambutol, all the patients passed the Ishihara, FD15, and Lanthony tests. From the fourth to the sixth month follow-up, all had normal color vision in all three tests. There was no complaint of blurring of vision or any other ocular disturbances at anytime during the study period (Table 3). Assessment of visual acuity did not show any significant change from baseline in any of the subjects. Fundus examination, anterior-segment slitlamp findings, and intraocular pressure were normal at all points during the study.
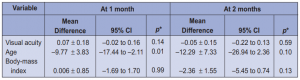
To determine if actual drug dose correlated with the incidence of druginduced color-vision change, the mean dose in mg/kg/day was computed per patient and correlated with the occurrence of color-vision deficiency. The mean dose of each drug used is shown in Table 4. There was no significant difference in mean dosages between patients who passed and failed during the second and third follow-ups. All drug dosages, particularly of ethambutol and isoniazid, were within acceptable daily allowances and did not have any significant association with the development of color-vision changes. Our study population had a wide age range of 13 to 75 years. The mean age of the patients was 38.96 ± 15.96. The mean age of the 30 subjects who developed colorvision deficiency on the second month of follow-up was 43.87 ± 2.70.years. The mean age of the 34 subjects who did not develop any color-vision abnormality was 34.09 ± 15.75 years. There was statistically significant difference in the age between those who developed color-vision deficiency and those who did not.

It was observed that subjects who passed the Lanthony test were significantly younger than those who failed. In the sequential third to the sixth month of treatment, no statistical difference was noted between the 2 groups. In terms of BMI, no significant difference was noted between subjects who passed and those who failed the color-vision tests (Table 3). Although there was an increased likelihood of developing color disturbances among overweight subjects, the difference was not statistically significant (Table 5). In terms of gender, the proportions of males and females who failed and those who passed the Lanthony test on the second follow-up were not significantly different (Table 6). The relative-risk point estimate was 1.18 and was not statistically significant (95% confidence interval, 0.68-2.05). The estimated odds of having abnormal findings were 1.39 times higher among female subjects. Being female maybe a risk factor but no statistical significance was noted
(Table 5).
DISCUSSION
Since the Philippines is among the 22 countries with a heavy TB burden,3 local ophthalmologists will continue
to see cases of ocular toxicity secondary to antituberculosis therapy. The ocular toxicity is generally described
as dose- and duration-related.8 The WHO has set the daily dose of ethambutol at 15 to 20 mg/kg body weight. At this dose, toxicity has been reported to occur in less than 1% of patients. However, the WHO also
recognized that no clinically effective dose is totally free from the possibility of ocular toxicity.4 Color-vision abnormality has been reported to be an early indicator of toxicity.8 In our study, the patients received an average dose of 17.99 ± 1.75 mg/kg/day of ethambutol for 2 months. After only 39.66 ± 1.62 days of treatment, 46.88% already demonstrated color-vision abnormalities using the Lanthony Desaturated test. The
results of the Ishihara Pseudoisochromatic test remained normal. The Ishihara test is the most commonly used screening tool for color-vision abnormalities. In most instances, it is the only test available. It is handy, conomical, and easy to administer and interpret. However, it is useful in detecting mainly congenital and acquired red-green deficiency and is of limited use in acquired blue-yellow deficits. This is supported by the results of our study where none of the subjects failed the Ishihara test and yet 48% failed the Lanthony test. In studies in India16 and Congo,8 the Ishihara test did not detect early color-vision abnormalities either. In the Congo study, color-vision defects were noted in 36 of 42 patients with the Farnsworth Munsell 100 Hue
test (FM 100) after 5 months of ethambutol treatment.8 In the color-arrangement tests, Farnsworth Panel D-15 and Lanthony Desaturated were used because these have been shown to be sensitive measures of color vision that can be analyzed quantitatively. Though the FM 100 hue test is the present gold standard, the FD 15 and the Lanthony tests have been reported to adequately predict the severity of color deficit at a fraction of time of the 100 hue test.17 Thus, they are more suitable for routine screening and monitoring for color-vision deficiency. The FD15 test was derived from the FM100 hue test. It was developed to categorize patients into safe and unsafe color deficiency in terms of occupations requiring basic color perceptions. However, the test is not sensitive in identifying individuals with subtle color-discrimination losses.
The Lanthony test has been reported to be sensitive in detecting subtle acquired blueyellow changes. It is analogous to the FD15 but uses Munsell colors of lower saturation and higher lightness. A study reported the calculated sensitivity and specificity for FD 15 at 64% and 100%, and for Lanthony at 84% and 89% respectively.18 In our study, using the more specific but less sensitive FD 15 test, only one out of 64 patients tested positive for color-vision abnormalities after 1 month of ethambutol therapy. Throughout the course of the study, visual acuity was unaffected in all subjects, indicating that acuity might be affected relatively late in the course of treatment. Thus, if monitoring is performed with visual acuity only, early reversible cases of toxicity can easily be missed. The literature suggested that the course of ethambutol-induced ocular toxicity was unpredictable. There were many reports of reversible toxicity on discontinuation of therapy, but permanent visual impairment has been documented. A local study by Inocencio and Castillo showed a very high rate of permanent visual loss (79.4%).5 Thus, it is important to have a screening tool sensitive enough to detect early toxicity so that early intervention in the form of drug withdrawal or a shift to another medication can be instituted. That the color-vision abnormalities reverted to normal in 83.33% of patients within an average of 12.63 days and in all patients within 37.85 days following cessation of ethambutol therapy supported this course of action. The type of color-vision abnormality induced by ethambutol has not been definitely established. Acquired color-vision changes such as those induced by anti-TB drugs can be classified into red-green and blue-yellow. Red-green defects are similar to inherited color defects such that color-vision test results for acquired and inherited conditions are almost the same. Inherited blue-yellow defects are rare and are usually perceived as acquired. Verriest classified acquired color defects into types I and II red-green and type III yellow-blue.19 Type-I acquired red-green defects have progressive deterioration that manifest early by chromatic confusion along the red-green axis associated with deficits in visual acuity. Type II acquired red-green defects consisted of a change in luminosity with moderate to severe chromatic discrimination deficit along the red-green axis, milder blue-yellow losses, and were associated with optic-nerve involvement. Type III defects associated with blue-yellow defects, may result from agerelated degeneration of the ocular media, choroid, retina, and glaucoma. Another method of classifying acquired color deficits is the Kollner’s rule of thumb. Kollner suggested that red-green defect may be due to damage to the optic nerve and visual pathway of the brain while blue-yellow may be secondary to damage in the integrity of the outer retinal layer that includes the cones.19 The exact mechanism remains unknown. Polak reported that blue-yellow color-vision changes can be an early finding in ethambutol toxicity.10 In the Congo study, the color axis of the color-deficient patients were as follows: narchic axis (13.1 %), red-green and blue-yellow combined axis (13.1 %), and blue-yellow axis (7.5 %).8 In our study, 66% of the color-vision abnormalities were unclassified based on the computer options. This indicated the absence of a definite axis of confusion or unresolved crossing. It was possible that more than one of the pure crossings (protan, deutan, tritan) may be present in a subject who failed the test. A third of cases were blue-yellow deficient, while no red-green cases were identified. In studies by Sjoerdsma and colleagues on goldfish, they postulated that ethambutol shifted the threshold for chromatic discrimination without changing the absolute sensitivity of the cone system.20 Furthermore, it was hypothesized that the most likely site of ethambutol toxicity was the inner plexiform layer and the most likely affected were the bipolar cells, amacrine cells,21 and horizontal cells.22 Among the risk factors identified for the development of ocular toxicity, only advanced age was significant. Degenerative processes within the nerve associated with aging may make the nerve more vulnerable to toxic insults. There was no correlation between the occurrence of colorvision abnormalities and either sex or BMI. Potential limitations of this study included losses to follow-up, which may have disproportionate effects on the results leading toward underestimation of association. Nonetheless, its strength of a prospective cohort study design and uniform scheduling of tests at a single site, plus the adherence to meticulous protocol used in the diagnosis of color-vision abnormalities among patients under anti-TB therapy, led to significant results. This study demonstrated several significant findings; namely, 1) there was a relatively high proportion of patients (46.88%) who developed color-vision abnormalities at therapeutically recommended doses; and 2) the abnormalities developed after a relatively short duration of treatment (39.65 days). It is reasonable, therefore, to presume that in cases of multidrug-resistant TB requiring higher doses and longer duration of therapy, the incidence of ocular toxicity could be even higher and likely to approach clinical significance. Fortunately, our results also showed that in all the patients, the color-vision abnormalities resolved shortly after discontinuation of ethambutol. This is in contrast to the relatively high persistence of color blindness among patients studied by Inocencio and Castillo.5 It may indicate that if the drug is discontinued soon enough, the abnormality can be completely resolved. Conversely, if the drug is used continuously when early toxicity is not recognized, the abnormality can persist and become permanent. Thus, early diagnosis using a sensitive indicator is necessary, and may be useful in preventing irreversible vision loss. We are starting the next phase of the study to determine the effects of other factors, i.e. alcohol and tobacco exposure, vitamin-B supplementation, in the development and course of drug-induced color-vision changes.
References
1. Department of Health. Research and Statistics. Mortality: ten leading causes – five-year average (2000-2004) and 2005. June 29, 2009: http://www.doh.gov.ph/ kp/statistics/leading_mortality (accessed September 4, 2009).
2. Department of Health. Research and Statistics. Morbidity: ten leading causes – five-year average (2000-2004) and 2005. June 29, 2009: http://www.doh.gov.ph/ kp/statistics/morbidity (accessed September 4, 2009).
3. World Health Organization. Tuberculosis Control in the Western Pacific Region 2009: http://www.wpro.who.int/NR/rdonlyres/2894B832-5677-4BB1-B01F 1962551F9304/0/tbcontrol_2009.pdf (accessed September 4, 2009).
4. World Health Organization. Ethambutol efficacy and toxicity: literature review and recommendations for daily and intermittent dosage in children 2006; http:// www.who.int/child_adolescent_health/documents/htm_tb_2006_365/en/ (accessed June 1, 2009).
5. Inocencio FP, Castillo TR. Toxic optic neuropathy secondary to ethambutol. Philipp J Ophthalmol 1999; 24: 65-68.
6. Lim SA. Ethambutol-associated optic neuropathy. Ann Acad Med Singapore 2006; 35: 274-278.
7. Chan RYC, Kwok AKH. Ocular toxicity of ethambutol. Hongkong Med J 2006; 12 56-60.
8. Kaimbo WAK, Bifuko ZA, Longo MB, et. al. Color vision in 42 Congolese patients with tuberculosis receiving ethambutol treatment. Bull Soc Belge Ophthalmol 2002; 284: 57-61.
9. Cruz EM, Cerdana HGS, Cabrera AMB, et al. Prevalence of color-vision deficiency among male high-school students. Philipp J Ophthalmol 2010; 35: 20-24.
10. Polak BC, Leys M, Van Lith GH. Blue-yellow color-vision changes as early symptoms of ethambutol culotoxicity. Int J Ophthalmol 1985; 191: 223-226.
11. Menon V, Jain D, Saxena R, Sood R. Prospective evaluation of visual function for early detection of ethambutol toxicity. Br J Ophthalmol 2009; 93:1251-1254.
12. World Health Organization. Global database on body-mass index. May 9, 2009: http://apps.who.int/bmi/index.jsp?introPage=intro_3.html (accessed June 5, 2009).
13. Ishihara S. The series plates designed as a test for color blindness. Kanehara & Co. Ltd. 1991.
14. Optical Diagnostics. Color Vision Recorder, version 4 user’s manual. June 15,
2008:http://www.opticaldiagnostics.com/products/cvr/cvr_manual.pdf (accessed January 5, 2009).
15. Open-Source Epidemiologic Statistics for Public Health. Sample size for crosssectional, cohort, and randomized clinical trial studies. May 20, 2009: http:// www.openepi.com/Menu/OpenEpiMenu.htm (accessed January 15, 2009).
16. Menon V, Jain D, Saxena R, Sood R. Prospective evaluation of visual function for early detection of thambutol toxicity. Br J Ophthalmol 2009; 93: 1251-1254.
17. Good GW, Schepler A, Nichols JJ. The reliability of the Lanthony Desaturated D-15 test. Optom Vis Sci 2005; 82: 1054-1059.
18. Bassi CJ, Galanis JC, Hoffman J. Comparison of the Farnsworth-Munsell 100-Hue, the Farnsworth D-15, and the L’Anthony D-15 Desaturated color tests. Arch Ophthalmol 1993; 111: 639-641.
19. Pease P. Color vision. In: Benjamin WJ, Borish IM, eds. Borish’s Clinical Refraction, 2nd edition. St. Louis, Missouri: Butterworth-Heinermann Elsevier, 2006; sec. 2, chap 9: 296-297.
20. Sjoerdsma T, Kamermans M, Spekreijse H. Effect of the tuberculostaticum ethambutol and stimulus intensity on chromatic discrimination in man. Vision Res J 1999; 39: 2955-2962.
21. Van Dijk BW, Spekreijse H. Ethambutol changes the color coding in the carp retinal ganglion cells reversibly. Invest Ophthalmol Vis Sci 1983; 24: 128-133.
22. Kohler K, Zrenner E, Weiler R. Ethambutol alters spinule type synaptic connections and induces morphologic alterations in the cone pedicles of the fish retina. Invest Ophthalmol Vis Sci 1995; 36: 1046-1055.
Acknowldgment
The authors thank the staff of District III Lanuza Health Center, especially Miss Editha M. Nemis, National Tuberculosis Program (NTP) nurse coordinator, for her assistance and Dr. Nichel V. Marquez for the statistical analysis.