Causes of Blindness and Severe Visual Impairment among Children Enrolled in an Early Intervention and Preschool Program of a School for the Blind in the Philippines
Paul Samuel V. Del Mundo, MD, Carlos Emmanuel M. Chua, MD
Blindness is a global burden. The overall prevalence of blindness worldwide is 0.7%, with at least 7 million people becoming blind each year, and increasing by 1-2 million per year. About 90% of the world’s visually impaired live in developing countries, remaining a public health problem.1,2 In children, the prevalence of childhood blindness ranged from 0.3/1000 children aged 0-15 years in developed countries to 1.5/1000 children in developing countries.3-5
In the Philippines, there was a steady decline in the prevalence of blindness,6 with cataract, error of refraction, and glaucoma as the most common causes of blindness, and error of refraction topping the list of visual impairment. In children, the top 3 causes of visual impairment and blindness were error or refraction, cataract, and phthisis bulbi.6 The prevalence of blindness among children did not decline compared with previous studies as there was no program for prevention of childhood blindness in the Philippines at that time.6
To achieve the goals of the National Prevention of Blindness Vision 2020, it is important to identify the causes of visual impairment and blindness in children. Population-based data are expensive and more difficult to obtain. An initial step would be to access and analyze the records of children enrolled in schools for the blind or other programs. This study, therefore, aimed to identify avoidable causes of childhood blindness and visual impairment in a school for the blind in the Philippines.
METHODOLOGY
The medical records of students enrolled at the Resources for the Blind (RBI) early intervention and preschool program from 1999 to 2012 were obtained. A standard examination record for children with blindness and low vision, developed by the WHO Prevention of Blindness (PBL),7 was used to record the data. Visual acuity was recorded according to the International Classification of Diseases, 10th Revision (ICD-10), where blindness was defined as visual acuity (VA) in the better eye worse than 3/60 (<20/400), severe visual impairment if VA was better than 3/60 (>20/400) but worse than 6/60 (<20/200), and visual impairment if VA was better than 6/60 (>20/200) but worse than 6/18 (<20/63)5. Excluded were those with no visual acuity nor diagnosis recorded.
The major anatomical site of abnormality and etiology of visual loss were determined for each eye and for each student. When two or more sites contributed to the visual impairment equally, or when sites of abnormality were different between the two eyes, the more preventable or treatable abnormality was selected. If neither eye had preventable or treatable abnormality, the more recent abnormality or the better eye was selected.7 Avoidable causes encompass both preventable and treatable causes. Preventable causes are conditions amenable to primary prevention where blindness can be entirely prevented; these include measles infection, vitamin A deficiency, ophthalmia neonatorum, adoption of harmful traditional eye practices, and intrauterine or perinatal infections.5 Treatable causes are conditions which can be treated early to prevent blindness (secondary prevention), such as glaucoma and ROP, or condition where sight can be restored (tertiary prevention), such as cataract or some cases of corneal opacities.5 Distribution of age, visual impairment, site and etiology of blindness, and avoidable causes were summarized using proportions.
RESULTS
A total of 147 medical records of children were reviewed. Seven were excluded because of incomplete diagnosis and 50 because of incomplete visual acuity measurements. A total of 90 records were included in the study. Eighty-six had visual acuity of either blind (76.7%) or severe visual impairment (18.9%) (Table 1). Of these, majority were children below 6 years of age (69.8%), and most were below 1 year (44.2%) (Table 2a). The mean age was 13 months with a range of 2 months to 11 years. There were 24 records with no recorded age (27.9%). There were more boys than girls (Table 2b).
Table 1. Classification of visual disability (N=90).
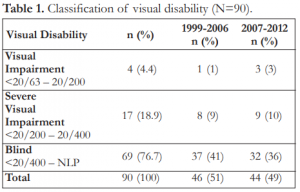
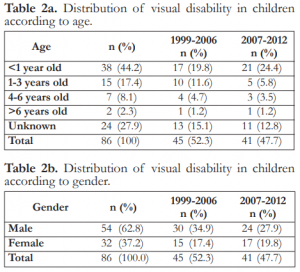
Table 2a. Distribution of visual disability in children according to age.
Table 2b. Distribution of visual disability in children according to gender.
Anatomic Causes
The anatomic causes of severe visual impairment and blindness (SVI/BL) are shown in Table 3. More than half were from the retina (69.8%), followed by the whole globe (10.5%), the lens (7%), and the optic nerve (7%). Retinopathy of prematurity was the most common cause of abnormality (47.7%), followed by retinoblastoma (11.6%). All cases of retinablastoma were bilateral for which enucleation was done. Other retinal causes included persistent hyperplastic primary vitreous (PHPV), retinal detachment, retinal dysplasia, retinal coloboma. Cataract was the most common cause of abnormality in the lens. Cortical blindness was the single cause of abnormality in a normal-appearing globe while microphthalmia led the causes of abnormality involving the whole globe.
Etiologic Causes
The etiologic causes of SVI/BL are shown in Table 4. Perinatal factors accounted for most of the etiologic causes of visual loss (58.1%). ROP and cerebral hypoxia comprised the prenatal factors in 47.7% and 5.8% respectively. In 18 children (20.9%), etiology of visual loss could not be determined; among these, 10.5% had retinoblastoma, 4.7% cataracts, and 4.7% with abnormality since birth. Hereditary factors accounted for 14% of visual loss. Childhood and intrauterine factors accounted for 5.8% and 1.2% respectively of all etiologic causes, including optic atrophy secondary to cerebral neoplasm and ocular toxoplasmosis.
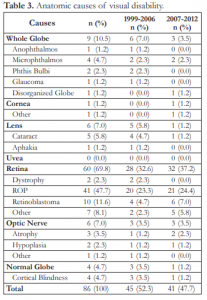
Table 3. Anatomic causes of visual disability.
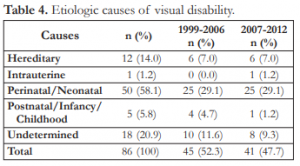
Table 4. Etiologic causes of visual disability.
Avoidable Causes of Blindness
Overall, 58.1% (49/86) of SVI/BL were avoidable; ocular toxoplasmosis was preventable (1.2%) and others were treatable (57.0%) (Table 5). The leading treatable causes of blindness were retinopathy of prematurity (47.7%) and cataract (5.8%). A total of 36 (41.9%) were unavoidable, mostly due to congenitally acquired causes.

Table 5. Avoidable and unavoidable causes of visual disability.
DISCUSSION
Most of the children enrolled in the Resources for the Blind early intervention and preschool program from 1999 to 2012 were below 6 years old (70%). This age range coincided with the target age population the program was aiming to serve. As a result, many of the causes of visual disability were due to perinatal etiology and less of childhood causes seen in a previous study done by Gilbert and Foster.12 There were also more males than females who enrolled in the program in a 2:1 ratio, similar to other studies in developing countries.3,8,9,10,11 There were also more students who were blind (80.2%) compared to those with severe visual impairment (19.8%). However, there was a significant number of medical records with no age included (27.9%), making the demographics somewhat uncertain.
Retinal disorders accounted for more than half of the anatomic causes of SVI/BL (69.8%); most of these were due to ROP (47.7%). The previous study by Gilbert and Foster done in blind schools in the Philippines in 1992 showed that retinal disorders ranked third following disorders of the whole globe (26.8%) and cornea (26.1%) as major causes of childhood SVI/BL.12 In that study, they compared prevalence of major anatomic sites based on the school location. They found that in the rural areas of Baguio and Davao, phthisis and corneal scarring secondary to vitamin A deficiency were the most common causes while in the urban areas of Manila, the most common cause was retinopathy of prematurity.
When we compared the number of ROP cases with the previous study done in Manila, its proportion increased from 16.7% to 47.7%. This increase could be attributed to increasing number of preterm births,13 survival of very low birth weight infants, and expanding neonatal and maternal services.8 Globally, only 15 countries accounted for two thirds of all pre-term births, and three of those countries were in East Asia, with the Philippines ranked 8th overall, third only to China and Indonesia.13 Infant mortality rate (IMR) has been declining steadily in the Philippines from 36.1/1000 live births in 1999 to 18.7/1000 live births in 2013,14 indicating improvement in healthcare delivery and socioeconomic development. IMR could also predict the risk of blindness due to ROP. In a previous study, the proportion of blindness due to ROP was plotted against IMR. The plot suggested that countries with high IMR of >60/1000 live births did not have a problem of blindness due to ROP because either neonatal ICU were not in place or premature babies did not survive long enough to develop severe ROP. Countries with very low IMRs (<9/1000 live births) also have lower rates of ROP blindness.11 This might be due to lower rates of prematurity, neonatal ICU care was good and oxygen supplementations were monitored, and babies who needed treatment were being detected and managed well. For countries like the Philippines with IMR in the range of 9-60/1000 live births, ROP is emerging as an important cause of blindness,11 as confirmed by our study.
In the previous study of Gilbert and Foster, the major causes of severe visual impairment and blindness were due to corneal scarring and phthisis bulbi, more notable in the rural areas of Baguio and Davao. This was also noted in other Asian studies where healthcare delivery was poor, especially in the rural regions where vitamin A deficiency and measles were a significant public health concern.15,16 In this study, there were no cases of vitamin A deficiency (VAD) or measles seen. VAD is a public health concern for preschool children in almost 122 countries worldwide.17 About 33.3% of preschool children are affected globally. Vitamin A deficiency in the Philippines has been slowly declining since 2003, from a prevalence of 40% to 15.2% in 2008 to 0.1-0.4% clinically evident.18 According to a World Bank report, the coverage for vitamin A supplementation in the Philippines reached 91% in 2010 from 76% in 2003.19 This was largely due to the universal vitamin A supplementation program of the Philippine government that started in 1993.18 Measles is also of public health significance in the Philippines with prevalence of 1/100,000 in 2013.20 The coverage of measles immunization in the country is 92% with supplemental immunization reaching 95% coverage.
Retinoblastoma was the second most common cause of blindness overall after ROP. In a study done in 2004, the incidence of retinoblastoma was estimated to be 237/100,000 of eye cases and has increased 5-fold over the last 35 years. The mean age of onset was between 12-18 months and bilateral in 30% of cases.22 In our study, retinoblastoma was found to cause blindness in 11.6% of students. It was bilateral in all cases and enucleation was done in all of them. The effect of bilateral blindness in these children and the age of onset were the significant reason for their increased enrollment in the program.
Cataract is a leading cause of surgically correctible blindness in the developing world with global incidence of 1-5/10,000 live births.8 In the previous study by Gilbert and Foster, cataract accounted for 14.5% of causes of severe visual loss and blindness.12 This was similar to other studies from Malaysia (17.2%), Thailand (16.9%), and Indonesia (16.4%).8,10,12 In our study, visual loss and blindness from cataract was found in 5.8% (5/86) of cases. A better access to healthcare, early detection, successful treatment outcomes, and various government programs might have contributed to the reduction of pediatric cataract cases. There is still a pressing need to continually address this by educating our primary healthcare providers and teachers and by formulating programs for vision screening in schools.
Most of the etiologic causes of childhood SVI/BL were due to perinatal/neonatal factors in 58.1%, such as retinopathy of prematurity (47.7%) and cerebral hypoxia leading to cortical blindness (5.8%), followed by unknown etiology in 20.9%, and hereditary causes in 14%. In the previous study by Gilbert and Foster, etiology of SVI/BL was unknown in 35.6% or due to childhood factors (31.7%) with perinatal/neonatal factors accounting for only 15%. This was mostly due to cataract and glaucoma, and VAD and measles keratopathy.12
In this study, 58.1% of students have avoidable causes of SVI/BL, which were preventable and treatable. Preventable causes (1.2%) constituted intrauterine factors, such as ocular toxoplasmosis when compared with the study by Gilbert and Foster where most of the preventable causes were due to VAD and measles.12 This could be due to the difference in population, where they studied a rural population while this study concentrated on an urban population. Most of the avoidable causes in this study were treatable in 57.0%, with ROP comprising the majority of treatable diseases. Cataract (5.8%) still remained a significant treatable cause in this study and was the leading cause of surgically correctible blindness in most developing countries such as Chile, Cyprus, and India.15 ROP was a significant treatable cause in this study and other studies in developing countries.8 ROP was found to be reaching epidemic proportions and becoming a public health problem not only in the Philippines but also in many developing countries.3
A large number of medical records (61/147) were not included in the study because of incomplete data and/or unavailability of medical records. Though inherent in this kind of study, inclusion of more records would be the norm if there was a standard form and method of recording the findings, such as the WHO/PBL ERCB, which could be used to keep the database of students in blind schools and hospitals.7
Studies on children in schools for the blind should be taken with caution because data from these studies may not be representative of the total childhood SVI/BL population and might be underestimated compared to a population-based study.3 To obtain a population-based childhood SVI/BL study, a large number of children are needed to obtain meaningful data on its causes because of its relatively low prevalence rate (0.46%) in the Philippines.6,3 Children from poor and remote communities and children with multiple handicaps are also greatly underrepresented because of inaccessibility of the schools and lack of trained personnel for handling multiple disabilities.6 Other reasons why these children may not enroll or seek help are because of parental fear and social stigma associated with any physical disability.8 However, data from blind school studies can provide valuable information on the major cause of childhood blindness in a particular area. A large number of children/medical records can be examined by a special team, using a standard methodology in a short period of time, making estimation of the prevalent causes possible.
In conclusion, more than half of the major causes of BL/SVI were potentially avoidable, with retinopathy of prematurity (ROP) as the leading etiology. It is recommended that a more comprehensive ROP awareness and screening programs be instituted at the institutional and national levels to help decrease the burden of this potentially avoidable disease. In addition, further hospital and population-based studies should be performed to validate these observations and establish the true prevalence and incidence of blindness in children.
REFERENCES
1. World Health Organization. Visual impairment and blindness. Med Cent WHO. Geneva: World Health Organization; 2011.
2. World Health Organization. Draft action plan for the prevention of avoidable blindness and visual impairment 2014-2019. WHO Executive Board 132nd session. Geneva: 2013.
3. Krishnaiah S, Subba RB, Lakshmi NK, Amit G. A survey of severe visual impairment in children attending schools for the blind in a coastal district of Andhra Pradesh in South India. Eye (Lond). 2012;26:1065-1070.
4. Thylefors B. A Global initiative for the prevention of avoidable blindness. Community Eye Health 1998;11:1–3.
5. Gilbert C, Foster A. Childhood blindness in the context of VISION 2020 – The Right to Sight. Bull World Health Organ 2001;79:227–232.
6. Cubillan LDP, Olivar-Santos EO. Third national survey on blindness. Philipp J Ophthalmol 2005; 30:100–114.
7. Gilbert C, Foster A, Negrel AD, Thylefors B. Childhood blindness: A new form for recording causes of visual loss in children. Bull World Health Organ 1993;71:485-9.
8. Patel DK, Tajunisah I, Gilbert C, Subrayan V. Childhood blindness and severe visual impairment in Malaysia: a nationwide study. Eye (Lond) 2011;25:436-442.
9. Heijthuijsen AAM, Beunders VAA, Jiawan D, et al. Causes of severe visual impairment and blindness in children in the Republic of Suriname. Br J Ophthalmol 2013;97:812-815.
10. Gogate P, Deshpande M, Sudrik S, et al. Changing pattern of childhood blindness in Maharashtra, India. Br J Ophthalmol 2007;91:8–12.
11. Gilbert C. Retinopathy of prematurity: A global perspective of the epidemics, population of babies at risk and implications for control. Early Hum Dev 2008; 84:77-82.
12. Gilbert C, Foster A. Causes of blindness in children attending four schools for the blind in Thailand and the Philippines: A comparison between urban and rural blind school populations. Int Ophthalmol 1993;17:229-234.
13. East Asia and Pacific – United Nation Children’s Fund. Premature birth leading cause of death among babies in East Asia-Pacific region [Internet]. New York: UNICEF. c2012 – Available from: http://www.unicef.org/eapro.
14. Central Intelligence Agency. The World Factbook 2013-14 [Internet]. Washington, DC: CIA. c2013 – Available from: https://www.cia.gov/library/publications/the-world-factbook/
15. Sitorus RS, Sulaiman AM, Prihartono J. Causes and temporal trends of childhood blindness in Indonesia: study at schools for the blind in Java. Br J Ophthalmol 2007;91:1109–1113.
16. Mosuro AL, Ajaiyeoba AI, Bekibele CO, et al. Survey of low vision among students attending schools for the blind in Nigeria: a descriptive and interventional study. Middle East Afr J Ophthalmol 2012;19:382–391.
17. World Health Organization. Global prevalence of vitamin A deficiency in populations at risk 1995–2005. WHO Global Database on Vitamin A Deficiency. Geneva: World Health Organization, 2009.
18. Mason JB, Lotfi M, Dalmiya N, et al. The micronutrient report: current progress and trends in the control of vitamin A, iron, and iodine deficiencies. Micronutrient Initiative 2001 [Available at: http://www.micronutrient.org/resources/publications/mn_report.pdf].
19. Trading Economics. World Bank report on vitamin A supplementation coverage rate in Philippines. Trading Economics c2010. [Available at: http://www.tradingeconomics.com/philippines/vitamin-a-supplementation-coverage-rate-percent-of-children-ages-6-59-months-wb-data.html]
20. World Health Organization. Country profile for measles elimination – Philippines. WHO Western Pacific Region c2012. [Available at: http://www.wpro.who.int/immunization/documents/measles_country_profile_apr2012_PHL.pdf]
21. World Health Organization. Reported measles cases and incidence rates by WHO member states 2012, 2013. WHO International. c2013 [Available at: http://www.who.int/immunization_monitoring/diseases/measlesreportedca sesbycountry.pdf].
22. Espiritu RB, De Jesus A, Valera E, Mercado G. Epidemiological pattern of retinoblastoma at the Philippine General Hospital. Philipp J Ophthalmol 2004;29: 136-9.