Baseline Retinal Nerve Fiber Layer Thickness and Visual Outcomes of Eyes with Ethambutol Toxic Optic Neuropathy
Franz Marie Cruz, MD, DPBO
Bilateral, painless vision loss is a recognized adverse effect of ethambutol. It is reported to occur in 1-5% of patients receiving anti-tuberculous treatment (ATT) containing ethambutol.1 The exact mechanism is unknown but it is believed to be a form of toxic optic neuropathy. The injury is hypothesized to affect the retinal ganglion cells and their axons as suggested by animal studies.2 Currently, there is no treatment for ethambutol-induced toxic neuropathy (ETON). However, immediate discontinuation of ethambutol has been shown to stop further vision loss and, at times, reverse it. Nevertheless, visual improvement is reported to occur in only a minority of patients with ETON.3,4 Visual recovery in eyes with ETON remains to be a controversial topic.5,6
Optical coherence tomography (OCT) is a non-invasive imaging tool that is widely available in many eye centers. It provides quantitative and qualitative information on the anterior and posterior segments of the eye. It is used in the diagnosis and monitoring of glaucoma and various retinal disorders.
Prior studies on application of OCT in ETON include evaluation of both circumpapillary retinal nerve fiber layer (cpRNFL) and macular ganglion cell-inner plexiform layer complex (MGC-IPL). Depending on the time point of evaluation, eyes with ETON were observed to have normal, thick, or thin RNFL measurements on OCT.1,7-9 Moreover, thinning of the MGC-IPL complex despite a corresponding thick temporal RNFL sector was reported in 1 eye with early ETON.1 Only 1 study described the visual outcomes in eyes with ETON in relation to baseline OCT measurements. In the study by Kim and Hwang involving 10 eyes of 5 patients with ETON, only 1 eye had thin sectoral RNFL measurements at baseline. The remaining eyes (9/10) had normal or thick RNFL measurements at baseline. On follow-up, despite development of RNFL thinning in the temporal quadrants in 2 eyes on serial OCT, all eyes exhibited improvements in visual acuity and color vision scores.
The objectives of this study are (1) to report the cpRNFL thickness of eyes with ETON at the time of diagnosis, and (2) to describe the visual outcomes of eyes diagnosed with ETON.
METHODS
This was a retrospective study involving patients with ETON seen at Peregrine Eye and Laser Institute.
A review of the electronic medical records of patients diagnosed with ETON from January 2013 to March 2017 was performed. Patients with baseline cpRNFL thickness measured by Cirrus® spectral-domain OCT were included in the study. Eyes with refractive errors greater than -6.00 diopter sphere, glaucoma, ocular hypertension, or prior diagnosis of non-glaucomatous optic neuropathy other than ETON were excluded. The diagnosis of ETON was made in the presence of (1) a clinical history of recent-onset, bilateral, progressive, painless vision loss after initiation of ATT containing ethambutol, (2) ocular findings that support a bilateral optic neuropathy including but not limited to reduced visual acuity, dyschromatopsia, central/cecocentral scotoma, and/or optic disc pallor, and (3) a negative cranial neuroimaging and laboratory work-up that would suggest other causes of optic neuropathy in select cases.
Demographic data such as age, sex, and race were collected. Pertinent information from the clinical history, such as duration from intake of ethambutol to onset of visual symptoms, and interval between onset of visual symptoms to discontinuation of the offending drug, were also noted down. Best-corrected visual acuities (BCVA) on the Snellenchart and color vision measured using the Ishihara pseudo-isochromatic 14-plate test chart at initial visit and months 1, 3, and 6 were recorded. Visual acuity measurements were converted to logMAR values.
Eyes were classified according to severity of visionloss. Eyes with visual acuity of logMAR 0.70 or less were considered to have mild vision loss; while, eyes with visual acuities from logMAR 0.80 to 1.10 were considered to have moderate vision loss. Lastly, eyes with visual acuities greater than logMAR 1.1 were classified to have severe vision loss. Color vision was considered normal if the score was greater than 9 on the Ishihara test plates. On the other hand, an Ishihara score 9 or less was consideredabnormal.
cpRNFL measurements were derived from a 200 x 200 cube optic disc scan using a Cirrus® HD OCT 4000 (Carl Zeiss, Meditec, Dublin, CA, USA). Global and sectoral cpRNFL thickness measurements were recorded. An abnormally thickened RNFL was reported when the thickness is greater than 99% of age-matched normal database. While thin RNFL was defined as thickness belonging to less than 1% of the age-matched normal database.
Statistical Analysis
Descriptive statistics was used to analyze the data. Paired-sample T-test was used to compare the means of BCVA and color vision score from one time-point to the immediate previous visit. A P <0.05 was considered statistically significant.
RESULTS
Eight patients (8) were included in the study. A total of 15 eyes were included in the final analysis. One eye was excluded due to a refractive error of >-6.00 diopter sphere. The baseline characteristics are presented in Table 1. Mean age [standard deviation] at presentation was 60 [17] years old. Majority were female (88%). Five (5 or 63%) out of 8 patients had pulmonary tuberculosis. The mean interval from initiation of ethambutol to onset of visual symptoms was 16 weeks. While, the mean duration from onset of visual symptoms to discontinuation of ethambutol was 4 weeks.
Table 1. Patient demographics and baseline characteristics
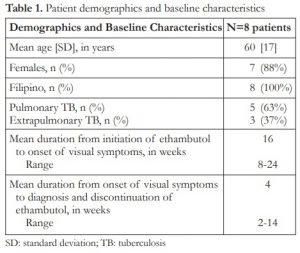
SD: standard deviation; TB: tuberculosis
The cpRNFL measurements at the time of diagnosis and discontinuation of ethambutol are presented in Table 2. Mean global cpRNFL thickness was 101.2 [17] microns. Six (6) out of 15 eyes had normal global cpRNFL thickness when compared to age-matched normal database. The remaining 9 eyes had thick global cpRNFL measurements. None of the eyes had thin global cpRNFL measurement at initial presentation. Mean [SD] cpRNFL in the temporal, superior, nasal and inferior sectors were as follows: 79.2 [15.4], 119.7 [27.9], 71.7 [9.2], and 136.7 [25.8] microns. All eyes had either normal or thick cpRNFL measurements in all quadrants. No sectoral thinning was observed in all 15 eyes. Additionally, thickening was most frequently observed in the temporal and inferior quadrants (33% each).
Table 2. Circumpapillary retinal nerve fiber layer thickness at the time of diagnosis
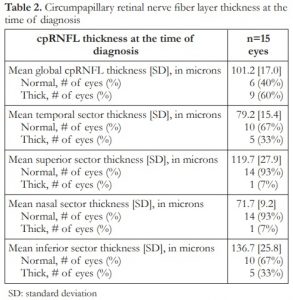
SD: standard deviation
Table 3 shows the BCVA and color vision during initial and follow-up visits. The mean [SD] logMAR VA at presentation, and at 1-, 3-, and 6-month follow-up visits were 1.23 [0.76], 0.96 [0.70], 0.63 [0.74], and 0.44 [0.63], respectively. There were significant differences in the mean BCVA between month 1 and initial visits (P =0.04), and between months 3 and 1 visits (P =0.00). Color vision scores were noted to increase from presentation to months 1, 3, and 6. Significant difference in the means of color vision scores between months 3 and 1 visits (P =0.00) was also observed.
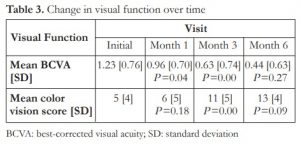
BCVA: best-corrected visual acuity; SD: standard deviation
Figure 1 shows the distribution of eyes according to severity of vision loss during the initial visit and at months 1, 3, and 6. Compared to baseline, there were progressively less eyes that had severe vision loss on succeeding visits. Figure 2 shows the number of eyes with normal and abnormal color vision scores during the initial visit and at months 1, 3, and 6. Compared to baseline, there were progressively fewer number of eyes that had abnormal color vision on succeeding visits. Conversely, more eyes had normal color vision by month 6 compared to baseline visit.
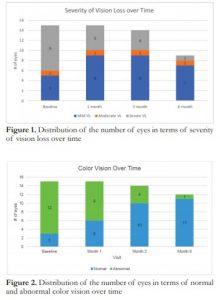
Figure 1. Distribution of the number of eyes in terms of severity of vision loss over time.
Figure 2. Distribution of the number of eyes in terms of normal and abnormal color vision over time
DISCUSSION
This study involves a small cohort of patients diagnosed with ETON. The rate of ETON among patients taking ethambutol is less than 5%. In a prospective study by Han, only 1 out of 37 patients treated with ATT containing ethambutol developed ETON (2.7%).1 Furthermore, the largest study on the role of OCT in patients with ETON comprised of 20 eyes of 10 subjects.10 Due to the relative rarity of the disease, our knowledge on the subject matter is rather limited.
In this study, mean duration from initiation of ethambutol therapy to onset of visual symptoms was 16 weeks or 4 months. This is consistent with other studies that reported the onset of visual symptoms from ETON to be 3 to 5 months after start of treatment.5 Whereas, the mean interval from onset of visual symptoms to discontinuation of ethambutol was 4 weeks. Baseline cpRNFL thicknesses were all either within the normal limits or thicker compared to the age-matched normal database. In addition, no eyes had thin cpRNFL measurements at baseline. This is similar to previous studies that demonstrated normal to thick RNFL in eyes with early ETON.9,10
Thick RNFL measurements suggest swelling of the retinal nerve fiber layer axons, possibly due to axoplasmic stasis.11 The pattern of RNFL thickening in this study showed that the temporal and inferior quadrants were most frequently affected. Thickening was observed in these quadrants in 33% of eyes each. The inferior cpRNFL is comprised of retinal ganglion axons coming from the inferior retina. While the temporal cpRNFL corresponds to the papillomacular bundle. ETON has been hypothesized to be a disease process with predilection to papillomacular bundle similar to Leber’s hereditary optic neuropathy and nutritional deficiency optic neuropathy.12 Thus, preferential involvement of temporal cpRNFL is not surprising. Thickening of the temporal cpRNFL in eyes with early ETON was also observed by Kim and Hwang, but it was not statistically significant from control.9
Of note, in this cohort of patients, visual recovery was good with more eyes displaying less severe visual acuity losses and abnormal color vision at month 6 visit compared to initial visit. Mean best-corrected visual acuity at month 6 was logMAR 0.44, equivalent to 20/50 on the Snellen chart. While color vision at 6-month visit was excellent, with mean color vision score of 13 out of 14 plates. Significant changes in the means of BCVA and color vision were observed in the first 3 months after discontinuation of ethambutol. It may be that early ETON with normal to thick RNFL measurements at the time of diagnosis and discontinuation of ethambutol may demonstrate good chances of visual improvement. Due to lack of heterogeneity in the baseline RNFL measurements (i.e. absence of eyes with thin RNFL), correlations between baseline RNFL measurements and visual outcomes could not be made.
Currently, there are no identified predictor for visual recovery in ETON.5 Daily and cumulative doses of ethambutol, duration of ethambutol intake, kidney function, body weight, and presence of comorbidities such as hypertension and diabetes mellitus have not been shown to be significant factors for visual improvement.13 A study by Tsai et al. suggested that age younger than 60 years at the time of diagnosis of ETON may be associated with better chances of recovery.14 However, the strength of the evidence was limited by the small sample size. While, optic atrophy at initial presentation is considered a poor prognostic sign, a more sensitive diagnostic test is desirable. We propose further studies be undertaken to explore the relationship between baseline cpRNFL and visual recovery in ETON. Baseline MGC-IPL measurements may demonstrate some utility in understanding the condition as well.
In compressive optic neuropathies and chiasmopathies, preoperative RNFL measurements have been shown to be good predictors for visual recovery after decompressive surgeries. Several studies have shown that normal or thick preoperative RNFL measurements were associated with improved visual functions after surgery.15-17 This information aids in preoperative counseling of patients on visual recovery. If such relationship does exist in ETON as well, OCT findings may help clinicians answer a time-old question almost always asked by patients with ETON, “Doc, will I gain my vision back?”.
Limitations of this study include small number of eyes with ETON and lack of heterogeneity in the baseline RNFL measurements. Other factors that could influence visual prognosis in eyes with ETON such as cumulative or daily dose of ethambutol, kidney function, and body weight were not included. Thickness of the macular ganglion cell complex at baseline and its relationship to visual outcome were also beyond the scope of the study.
In conclusion, findings of this study showed that in a small cohort of eyes with early ETON, cpRNFL measurements at the time of diagnosis was either thick or normal. In addition, good visual recovery in terms of visual acuity and color vision was observed in the same cohort 6 months after discontinuation of ethambutol.
REFERENCES
1. Han J, Byun MK, Lee J, Han SY et al. Longitudinal analysis of retinal nerve fiber layer and ganglion cell-inner plexiform layer thickness in ethambutol-induced optic neuropathy. Graefes Arch Clin Exp Ophthalmol. 2015;253:2293-9.
2. Kinoshita J, Iwata N, Maejima T, Kimotsuki T et al. Retinal function and morphology in monkeys with ethambutol-induced optic neuropathy. Invest Ophthalmol Vis Sci. 2012;53:7052-62.
3. Melamud A, Kosmorsky GS, Lee MS. Ocular Ethambutol Toxicity. Mayo Clin Proc. 2003;78:1409-11.
4. Lee EJ, Kim SJ, Choung HK, Kim JH et al. Incidence and clinical features of ethambutol-induced optic neuropathy in Korea. J Neuro-Ophthalmol. 2008;28:269-77.
5. Chan RYC, Kwok AKH. Ocular toxicity of ethambutol. Hong Kong Med J. 2006;12:56-60.
6. Song W, Si S. The rare ethambutol-induced optic neuropathy. Medicine. 2017;96:2(e5889).
7. Zoumalan CI, Agawal M, Sadun AA. Optical coherence tomography can measure axonal loss in patients with ethambutol-induced optic neuropathy. Graefes Arch Clin Exp Ophthalmol. 2005;243:410-6.
8. Menon V, Dain J. Saxena R, Sood R. Prospective evaluation of visual function for early detection of ethambutol toxicity. Br J Ophthalmol. 2009;93:1251-4.
9. Kim YK, Hwang JM. Serial Retinal Nerve Fiber Layer Changes in Patients with Toxic Optic Neuropathy associated with Antituberculous Pharmacotherapy. J Ocul Pharmacol Ther. 2009;25:53-5.
10. Ungsoo K, Hwang JM. Early stage ethambutol optic neuropathy: retinal nerve fiber layer and optical coherence tomography. Eur J Ophthalmol. 2009;19:466-9.
11. Kardon RH, Morrisey MC, Lee AG. Abnormal multifocal electroretinogram (mfERG) in ethambutol toxicity. Semin Ophthalmol. 2006;21:215-22.
12. Sadun AA, Wang MY. Ethambutol optic neuropathy: how can we prevent 100,000 new cases of blindness each year. J Neuroophthalmol. 2008;28:265-8.
13. Chen SC, Lin MC, Sheu SJ. Incidence and prognostic factor of ethambutol-related optic neuropathy: 10-year experience in southern Taiwan. Kaohsiung J Med Sci. 2015;31:358-62.
14. Tsai RK, Lee YH. Reversibility of ethambutol optic neuropathy. J Ocular Pharm Therapeutics. 1997;13:473-7.
15. Jacob M, Raverot G, Jouanneau E, Borson-Chazot F et al. Predicting visual outcome after treatment of pituitary adenomas with optical coherence tomography. Am J Ophthalmol. 2009;147:64-70.
16. Park HH, Oh MC, Kim EH, Kim CY, et al. Use of optical coherence tomography to predict visual outcome in parachiasmal meningioma. J Neurosurg. 2015;123:1489-99.
17. Loo JL, Tian J, Miller NR, Subramanian PS. Use of optical coherence tomography in predicting post-treatment visual outcome in anterior visual pathway meningiomas. Br J Ophthalmol. 2013;97:1455-8.